Supported by Dr. Osamu Ogasawara and  . . |
|
Last data update: 2014.03.03 |
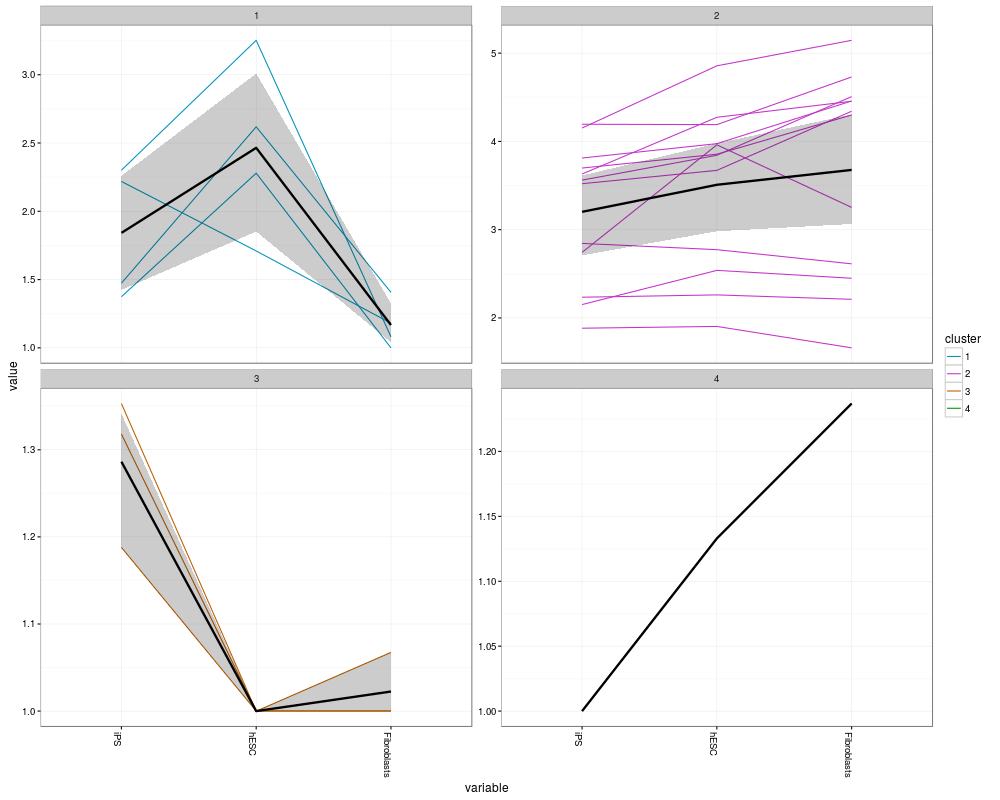
csClusterPlotDescriptionReplaces the default plotting behavior of the old csCluster. Takes as an argument the output of csCluster and plots expression profiles of features facet by cluster. UsagecsClusterPlot(clustering, pseudocount=1.0,logMode=FALSE,drawSummary=TRUE,sumFun=mean_cl_boot) Arguments
DetailsThis replaces the default plotting behavior of the old csCluster() method. This was necessary so as to preserve the cluster information obtained by csCluster in a stable format. The output of csClusterPlot is a ggplot2 object of expressionProfiles faceted by cluster ID. ValueA ggplot2 object of expressionProfiles faceted by cluster ID. NoteNone. Author(s)Loyal A. Goff ReferencesNone. Examplesdata(sampleData) myClustering<-csCluster(sampleGeneSet,k=4) csClusterPlot(myClustering) Results
R version 3.3.1 (2016-06-21) -- "Bug in Your Hair"
Copyright (C) 2016 The R Foundation for Statistical Computing
Platform: x86_64-pc-linux-gnu (64-bit)

R is free software and comes with ABSOLUTELY NO WARRANTY.
You are welcome to redistribute it under certain conditions.
Type 'license()' or 'licence()' for distribution details.

R is a collaborative project with many contributors.
Type 'contributors()' for more information and
'citation()' on how to cite R or R packages in publications.

Type 'demo()' for some demos, 'help()' for on-line help, or
'help.start()' for an HTML browser interface to help.
Type 'q()' to quit R.

> library(cummeRbund)
Loading required package: BiocGenerics
Loading required package: parallel

Attaching package: 'BiocGenerics'

The following objects are masked from 'package:parallel':

    clusterApply, clusterApplyLB, clusterCall, clusterEvalQ,
    clusterExport, clusterMap, parApply, parCapply, parLapply,
    parLapplyLB, parRapply, parSapply, parSapplyLB

The following objects are masked from 'package:stats':

    IQR, mad, xtabs

The following objects are masked from 'package:base':

    Filter, Find, Map, Position, Reduce, anyDuplicated, append,
    as.data.frame, cbind, colnames, do.call, duplicated, eval, evalq,
    get, grep, grepl, intersect, is.unsorted, lapply, lengths, mapply,
    match, mget, order, paste, pmax, pmax.int, pmin, pmin.int, rank,
    rbind, rownames, sapply, setdiff, sort, table, tapply, union,
    unique, unsplit

Loading required package: RSQLite
Loading required package: DBI
Loading required package: ggplot2
Loading required package: reshape2
Loading required package: fastcluster

Attaching package: 'fastcluster'

The following object is masked from 'package:stats':

    hclust

Loading required package: rtracklayer
Loading required package: GenomicRanges
Loading required package: S4Vectors
Loading required package: stats4

Attaching package: 'S4Vectors'

The following objects are masked from 'package:base':

    colMeans, colSums, expand.grid, rowMeans, rowSums

Loading required package: IRanges
Loading required package: GenomeInfoDb
Loading required package: Gviz
Loading required package: grid

Attaching package: 'cummeRbund'

The following object is masked from 'package:GenomicRanges':

    promoters

The following object is masked from 'package:IRanges':

    promoters

The following object is masked from 'package:BiocGenerics':

    conditions

> png(filename="/home/ddbj/snapshot/RGM3/R_BC/result/cummeRbund/csClusterPlot.Rd_%03d_medium.png", width=480, height=480)
> ### Name: csClusterPlot
> ### Title: csClusterPlot
> ### Aliases: csClusterPlot
>
> ### ** Examples
>
> 	data(sampleData)
> 	myClustering<-csCluster(sampleGeneSet,k=4)
Loading required package: cluster
Using tracking_id, sample_name as id variables
> 	csClusterPlot(myClustering)
>
>
>
>
>
> dev.off()
null device
          1
>
|