Supported by Dr. Osamu Ogasawara and  . . |
|
Last data update: 2014.03.03 |
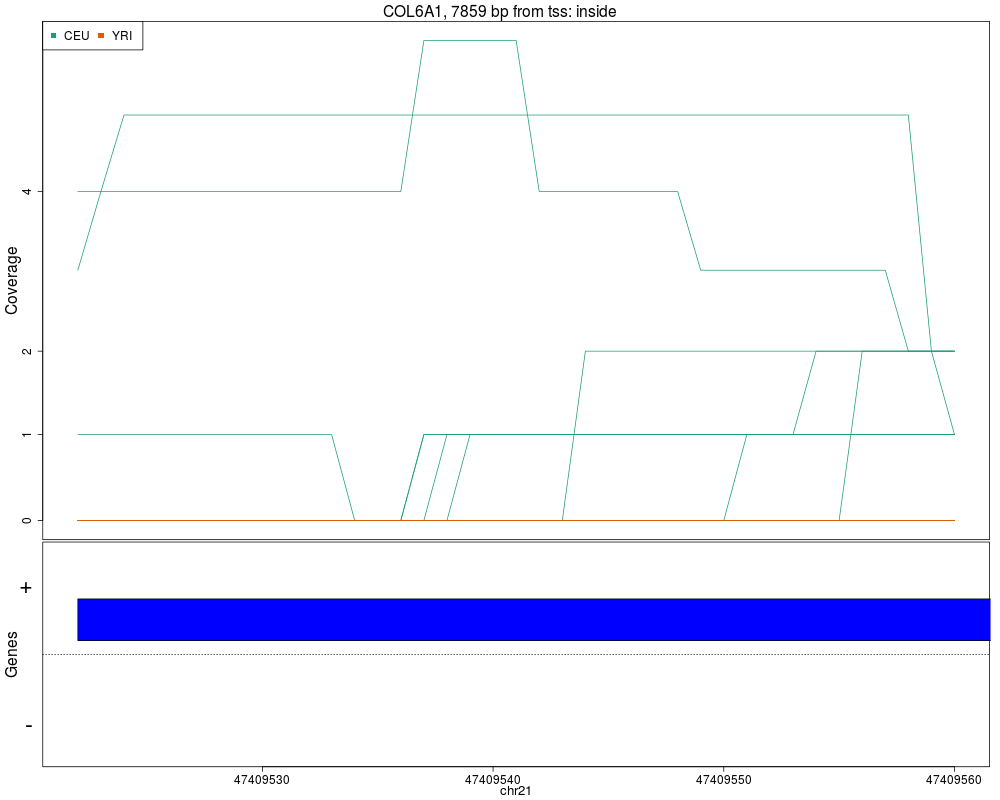
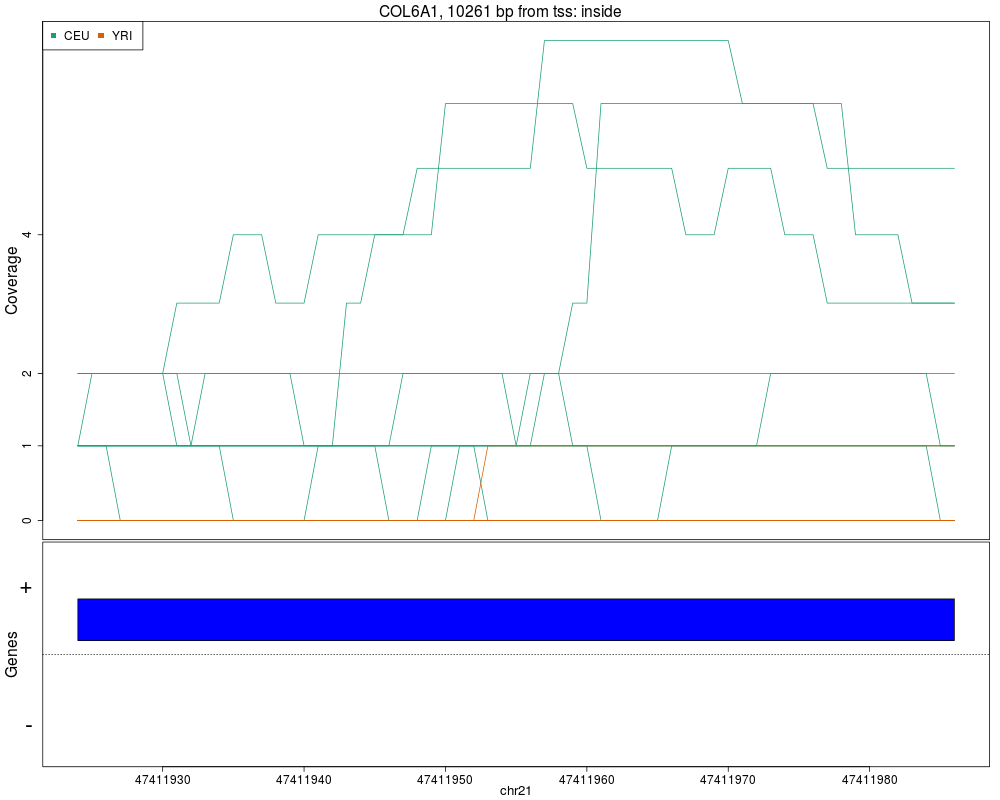
Makes plots for every region while summarizing the annotationDescriptionThis function takes the regions found in calculatePvalues and assigns them genomic states contructed with makeGenomicState. The main workhorse functions are countOverlaps and findOverlaps. For an alternative plot check plotCluster which is much slower and we recommend it's use only after quickly checking the results with this function. UsageplotRegionCoverage(regions, regionCoverage, groupInfo, nearestAnnotation, annotatedRegions, txdb = NULL, whichRegions = seq_len(min(100, length(regions))), colors = NULL, scalefac = 32, ask = interactive(), ylab = "Coverage", verbose = TRUE) Arguments
ValueA plot for every region showing the coverage of each sample at each base of the region as well as the summarized annotation information. Author(s)Andrew Jaffe, Leonardo Collado-Torres See AlsocalculatePvalues, getRegionCoverage, annotateNearest, annotateRegions, plotCluster Examples
## Load data
library('derfinder')
## Annotate regions, first two regions only
regions <- genomeRegions$regions[1:2]
annotatedRegions <- annotateRegions(regions = regions,
genomicState = genomicState$fullGenome, minoverlap = 1)
## Find nearest annotation with bumphunter::matchGenes()
library('bumphunter')
library('TxDb.Hsapiens.UCSC.hg19.knownGene')
genes <- annotateTranscripts(txdb = TxDb.Hsapiens.UCSC.hg19.knownGene)
nearestAnnotation <- matchGenes(x = regions, subject = genes)
## Obtain fullCov object
fullCov <- list('21'=genomeDataRaw$coverage)
## Assign chr lengths using hg19 information
library('GenomicRanges')
data(hg19Ideogram, package = 'biovizBase', envir = environment())
seqlengths(regions) <- seqlengths(hg19Ideogram)[names(seqlengths(regions))]
## Get the region coverage
regionCov <- getRegionCoverage(fullCov=fullCov, regions=regions)
## Make plots for the regions
plotRegionCoverage(regions=regions, regionCoverage=regionCov,
groupInfo=genomeInfo$pop, nearestAnnotation=nearestAnnotation,
annotatedRegions=annotatedRegions, whichRegions=1:2)
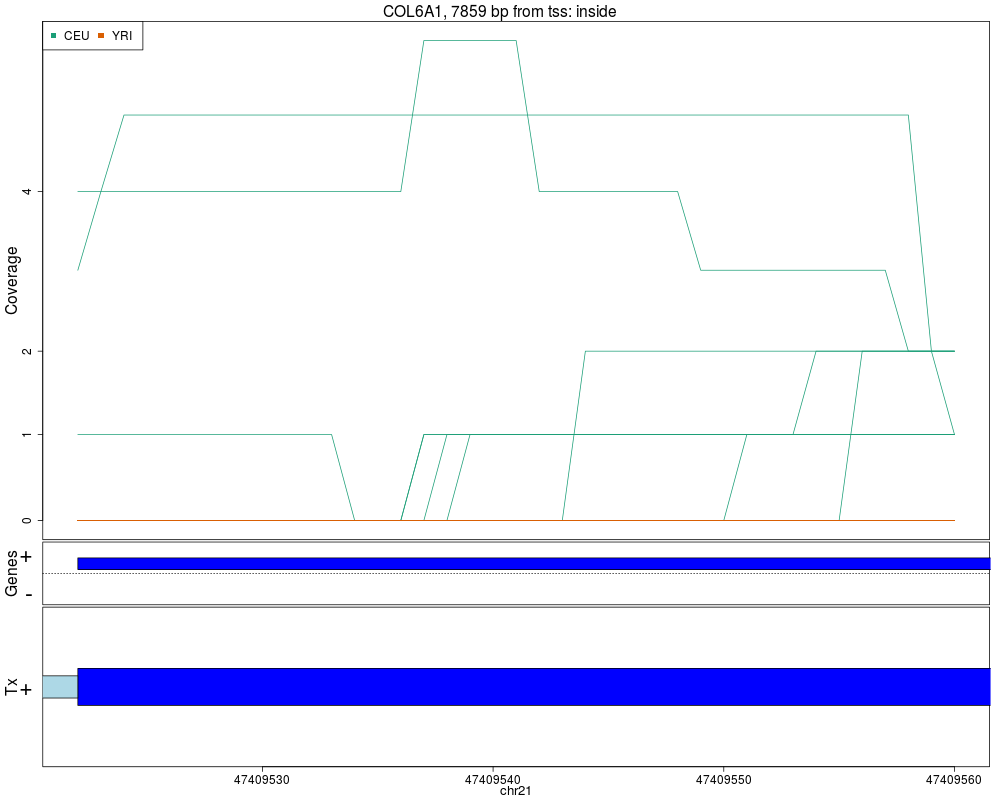
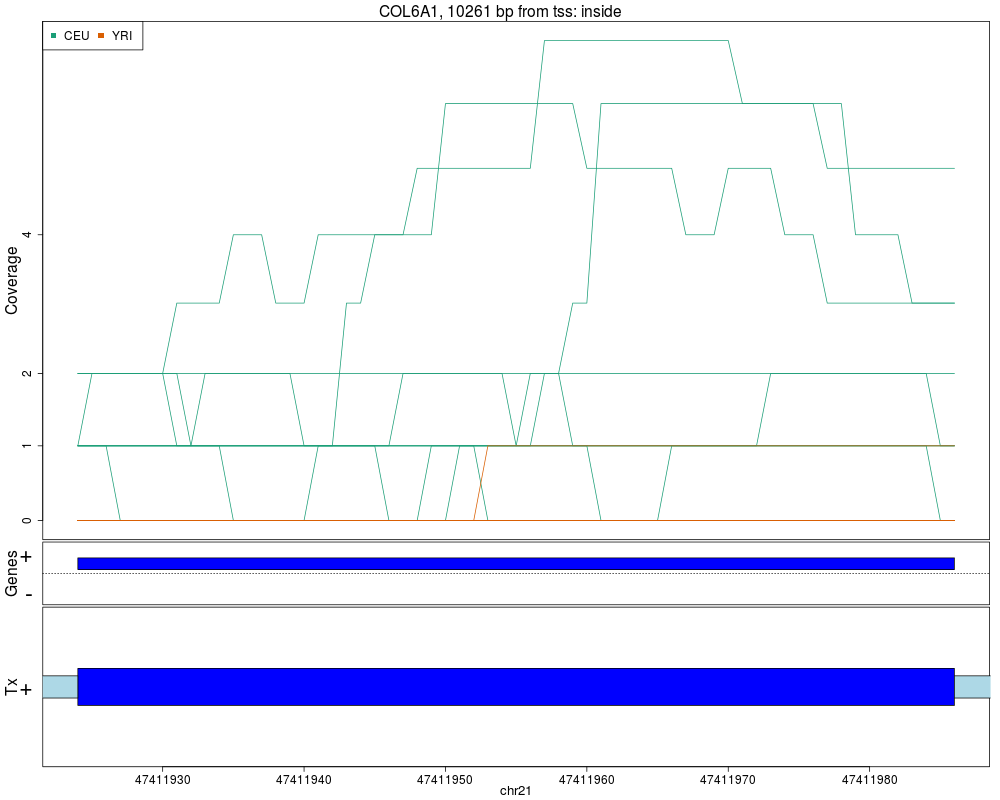
## Re-make plots with transcript information
plotRegionCoverage(regions=regions, regionCoverage=regionCov,
groupInfo=genomeInfo$pop, nearestAnnotation=nearestAnnotation,
annotatedRegions=annotatedRegions, whichRegions=1:2,
txdb = TxDb.Hsapiens.UCSC.hg19.knownGene)
## Not run:
## If you prefer, you can save the plots to a pdf file
pdf('ders.pdf', h = 6, w = 9)
plotRegionCoverage(regions=regions, regionCoverage=regionCov,
groupInfo=genomeInfo$pop, nearestAnnotation=nearestAnnotation,
annotatedRegions=annotatedRegions, whichRegions=1:2,
txdb = TxDb.Hsapiens.UCSC.hg19.knownGene, ask = FALSE)
dev.off()
## End(Not run)
Results
R version 3.3.1 (2016-06-21) -- "Bug in Your Hair"
Copyright (C) 2016 The R Foundation for Statistical Computing
Platform: x86_64-pc-linux-gnu (64-bit)

R is free software and comes with ABSOLUTELY NO WARRANTY.
You are welcome to redistribute it under certain conditions.
Type 'license()' or 'licence()' for distribution details.

R is a collaborative project with many contributors.
Type 'contributors()' for more information and
'citation()' on how to cite R or R packages in publications.

Type 'demo()' for some demos, 'help()' for on-line help, or
'help.start()' for an HTML browser interface to help.
Type 'q()' to quit R.

> library(derfinderPlot)
Warning message:
replacing previous import 'ggplot2::Position' by 'BiocGenerics::Position' when loading 'ggbio'
> png(filename="/home/ddbj/snapshot/RGM3/R_BC/result/derfinderPlot/plotRegionCoverage.Rd_%03d_medium.png", width=480, height=480)
> ### Name: plotRegionCoverage
> ### Title: Makes plots for every region while summarizing the annotation
> ### Aliases: plotRegionCoverage
>
> ### ** Examples
>
> ## Load data
> library('derfinder')
>
> ## Annotate regions, first two regions only
> regions <- genomeRegions$regions[1:2]
> annotatedRegions <- annotateRegions(regions = regions,
+     genomicState = genomicState$fullGenome, minoverlap = 1)
2016-07-06 14:47:28 annotateRegions: counting
2016-07-06 14:47:28 annotateRegions: annotating
>
> ## Find nearest annotation with bumphunter::matchGenes()
> library('bumphunter')
Loading required package: S4Vectors
Loading required package: stats4
Loading required package: BiocGenerics
Loading required package: parallel

Attaching package: 'BiocGenerics'

The following objects are masked from 'package:parallel':

    clusterApply, clusterApplyLB, clusterCall, clusterEvalQ,
    clusterExport, clusterMap, parApply, parCapply, parLapply,
    parLapplyLB, parRapply, parSapply, parSapplyLB

The following objects are masked from 'package:stats':

    IQR, mad, xtabs

The following objects are masked from 'package:base':

    Filter, Find, Map, Position, Reduce, anyDuplicated, append,
    as.data.frame, cbind, colnames, do.call, duplicated, eval, evalq,
    get, grep, grepl, intersect, is.unsorted, lapply, lengths, mapply,
    match, mget, order, paste, pmax, pmax.int, pmin, pmin.int, rank,
    rbind, rownames, sapply, setdiff, sort, table, tapply, union,
    unique, unsplit


Attaching package: 'S4Vectors'

The following objects are masked from 'package:base':

    colMeans, colSums, expand.grid, rowMeans, rowSums

Loading required package: IRanges
Loading required package: GenomeInfoDb
Loading required package: GenomicRanges
Loading required package: foreach
Loading required package: iterators
Loading required package: locfit
locfit 1.5-9.1 	 2013-03-22
> library('TxDb.Hsapiens.UCSC.hg19.knownGene')
Loading required package: GenomicFeatures
Loading required package: AnnotationDbi
Loading required package: Biobase
Welcome to Bioconductor

    Vignettes contain introductory material; view with
    'browseVignettes()'. To cite Bioconductor, see
    'citation("Biobase")', and for packages 'citation("pkgname")'.

> genes <- annotateTranscripts(txdb = TxDb.Hsapiens.UCSC.hg19.knownGene)
No annotationPackage supplied. Trying org.Hs.eg.db.
Loading required package: org.Hs.eg.db

Getting TSS and TSE.
Getting CSS and CSE.
Getting exons.
Annotating genes.
Warning message:
  Calling species() on a TxDb object is *deprecated*.
  Please use organism() instead.
> nearestAnnotation <- matchGenes(x = regions, subject = genes)
>
> ## Obtain fullCov object
> fullCov <- list('21'=genomeDataRaw$coverage)
>
> ## Assign chr lengths using hg19 information
> library('GenomicRanges')
> data(hg19Ideogram, package = 'biovizBase', envir = environment())
> seqlengths(regions) <- seqlengths(hg19Ideogram)[names(seqlengths(regions))]
>
> ## Get the region coverage
> regionCov <- getRegionCoverage(fullCov=fullCov, regions=regions)
extendedMapSeqlevels: sequence names mapped from NCBI to UCSC for species homo_sapiens
2016-07-06 14:47:48 getRegionCoverage: processing chr21
2016-07-06 14:47:48 getRegionCoverage: done processing chr21
> ## Make plots for the regions
> plotRegionCoverage(regions=regions, regionCoverage=regionCov,
+     groupInfo=genomeInfo$pop, nearestAnnotation=nearestAnnotation,
+     annotatedRegions=annotatedRegions, whichRegions=1:2)
>
> ## Re-make plots with transcript information
> plotRegionCoverage(regions=regions, regionCoverage=regionCov,
+     groupInfo=genomeInfo$pop, nearestAnnotation=nearestAnnotation,
+     annotatedRegions=annotatedRegions, whichRegions=1:2,
+     txdb = TxDb.Hsapiens.UCSC.hg19.knownGene)
2016-07-06 14:47:48 plotRegionCoverage: extracting Tx info
2016-07-06 14:47:50 plotRegionCoverage: getting Tx plot info
>
> ## Not run:
> ##D ## If you prefer, you can save the plots to a pdf file
> ##D pdf('ders.pdf', h = 6, w = 9)
> ##D plotRegionCoverage(regions=regions, regionCoverage=regionCov,
> ##D     groupInfo=genomeInfo$pop, nearestAnnotation=nearestAnnotation,
> ##D     annotatedRegions=annotatedRegions, whichRegions=1:2,
> ##D     txdb = TxDb.Hsapiens.UCSC.hg19.knownGene, ask = FALSE)
> ##D dev.off()
> ## End(Not run)
>
>
>
>
>
> dev.off()
null device
          1
>
|