Supported by Dr. Osamu Ogasawara and  . . |
|
Last data update: 2014.03.03 |
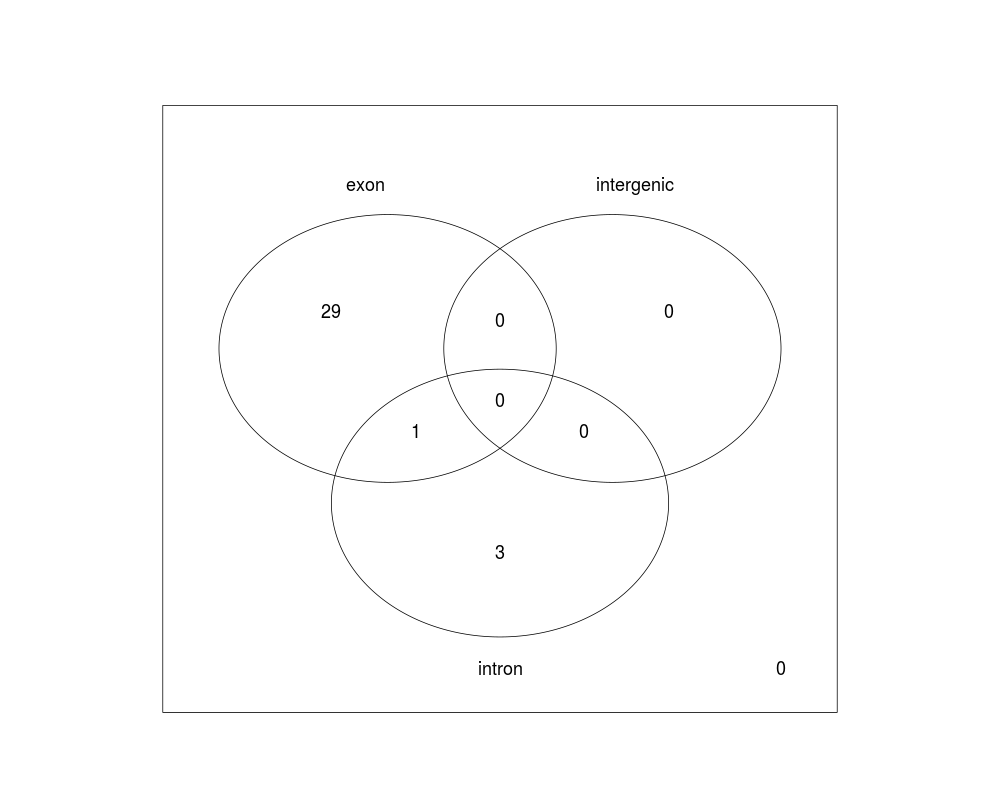
Venn diagram for annotated regions given the genomic stateDescriptionMakes a venn diagram for the regions given the genomic state showing how many regions overlap introns, exons, intergenic regions, none or multiple groups. UsagevennRegions(annotatedRegions, subsetIndex = NULL, ...) Arguments
ValueMakes a venn diagram plot for the annotation given the genomic state and the actual venn counts used to make the plot. Author(s)Leonardo Collado-Torres See AlsoannotateRegions, vennCounts, vennDiagram Examples
## Load data
library('derfinder')
## Annotate regions
annotatedRegions <- annotateRegions(regions = genomeRegions$regions,
genomicState = genomicState$fullGenome, minoverlap = 1)
## Make venn diagram
venn <- vennRegions(annotatedRegions)
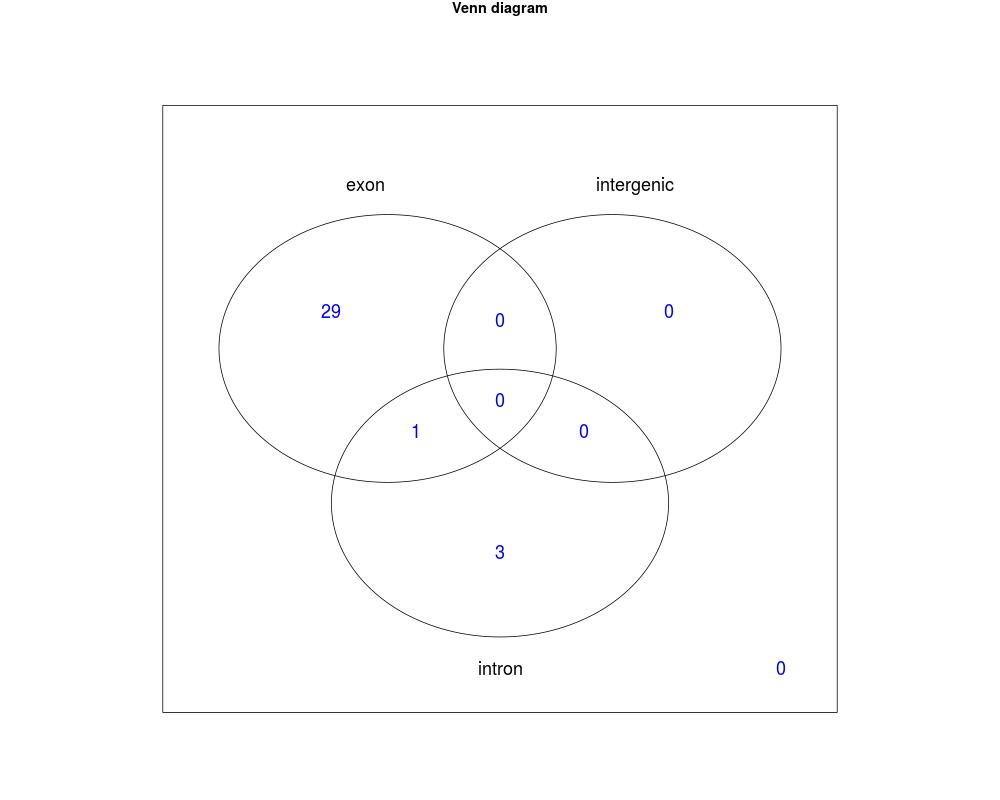
## Add title and choose text color
venn2 <- vennRegions(annotatedRegions, main = 'Venn diagram', counts.col =
'blue')
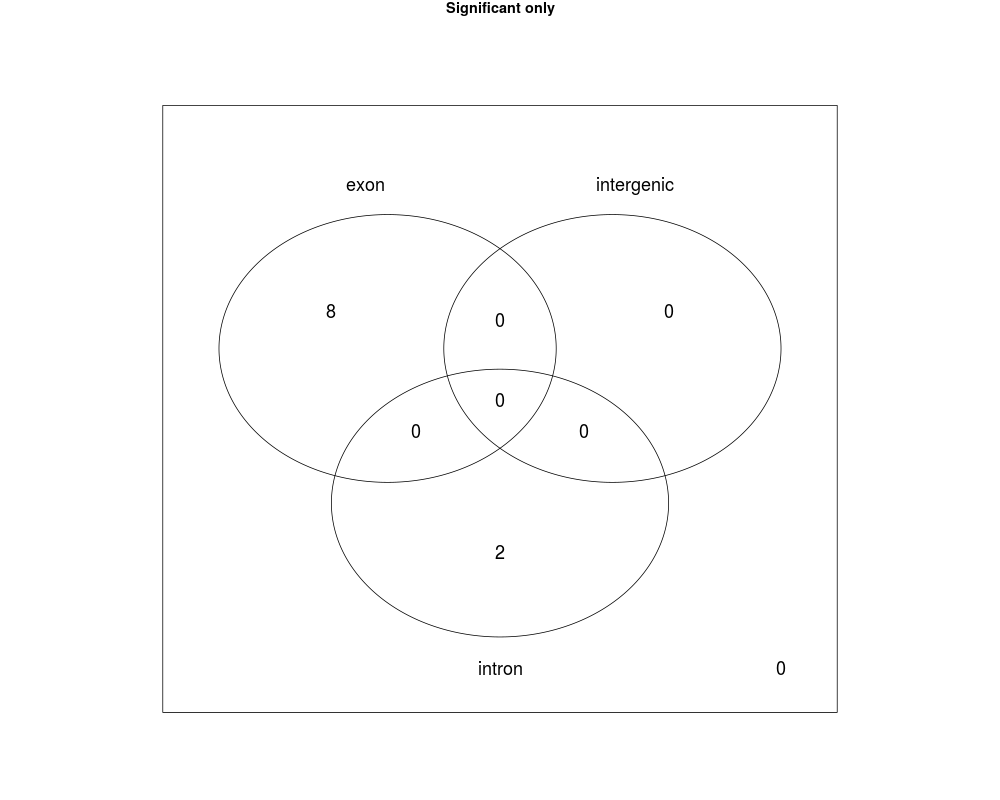
## Subset to only significant regions, so you don't have to annotate them
## again
venn3 <- vennRegions(annotatedRegions, subsetIndex =
genomeRegions$regions$significant == 'TRUE', main = 'Significant only')
Results
R version 3.3.1 (2016-06-21) -- "Bug in Your Hair"
Copyright (C) 2016 The R Foundation for Statistical Computing
Platform: x86_64-pc-linux-gnu (64-bit)

R is free software and comes with ABSOLUTELY NO WARRANTY.
You are welcome to redistribute it under certain conditions.
Type 'license()' or 'licence()' for distribution details.

R is a collaborative project with many contributors.
Type 'contributors()' for more information and
'citation()' on how to cite R or R packages in publications.

Type 'demo()' for some demos, 'help()' for on-line help, or
'help.start()' for an HTML browser interface to help.
Type 'q()' to quit R.

> library(derfinderPlot)
Warning message:
replacing previous import 'ggplot2::Position' by 'BiocGenerics::Position' when loading 'ggbio'
> png(filename="/home/ddbj/snapshot/RGM3/R_BC/result/derfinderPlot/vennRegions.Rd_%03d_medium.png", width=480, height=480)
> ### Name: vennRegions
> ### Title: Venn diagram for annotated regions given the genomic state
> ### Aliases: vennRegions
>
> ### ** Examples
>
> ## Load data
> library('derfinder')
>
> ## Annotate regions
> annotatedRegions <- annotateRegions(regions = genomeRegions$regions,
+     genomicState = genomicState$fullGenome, minoverlap = 1)
2016-07-06 14:47:31 annotateRegions: counting
2016-07-06 14:47:31 annotateRegions: annotating
>
> ## Make venn diagram
> venn <- vennRegions(annotatedRegions)
>
> ## Add title and choose text color
> venn2 <- vennRegions(annotatedRegions, main = 'Venn diagram', counts.col =
+     'blue')
>
> ## Subset to only significant regions, so you don't have to annotate them
> ## again
> venn3 <- vennRegions(annotatedRegions, subsetIndex =
+     genomeRegions$regions$significant == 'TRUE', main = 'Significant only')
>
>
>
>
>
> dev.off()
null device
          1
>
|
Created & Maintained by Osamu Ogasawara (osamu.ogasawara@gmail.com) and 