Data set with n samples. Can be a data.frame, matrix or ExpressionSet.
step.size
Size of log-sigma steps
steps
Number of steps/calculations
start
Initial value to search from. (Optional. default: log_10(min(dist(data))))
sample.rows
Number of random rows to use for sigma estimation or vector of row indices/names to use.
In the first case, only used if actually smaller than the number of available rows (Optional. default: 500)
early.exit
logical. If TRUE, return if the first local maximum is found, else keep running
...
All parameter after this are optional and have to be specified by name
censor.val
Value regarded as uncertain. Either a single value or one for every dimension
censor.range
Uncertainity range for censoring. A length-2-vector of certainty range start and end. TODO: also allow 2\times G matrix
missing.range
Whole data range for missing value model. Has to be specified if NAs are in the data
vars
Variables (columns) of the data to use. Specifying TRUE will select all columns (default: All floating point value columns)
verbose
logical. If TRUE, show a progress bar and plot the output
Value
Object of class Sigmas
See Also
Sigmas, the class returned by this; DiffusionMap, the class this is used for
R version 3.3.1 (2016-06-21) -- "Bug in Your Hair"
Copyright (C) 2016 The R Foundation for Statistical Computing
Platform: x86_64-pc-linux-gnu (64-bit)
R is free software and comes with ABSOLUTELY NO WARRANTY.
You are welcome to redistribute it under certain conditions.
Type 'license()' or 'licence()' for distribution details.
R is a collaborative project with many contributors.
Type 'contributors()' for more information and
'citation()' on how to cite R or R packages in publications.
Type 'demo()' for some demos, 'help()' for on-line help, or
'help.start()' for an HTML browser interface to help.
Type 'q()' to quit R.
> library(destiny)
Loading required package: Biobase
Loading required package: BiocGenerics
Loading required package: parallel
Attaching package: 'BiocGenerics'
The following objects are masked from 'package:parallel':
clusterApply, clusterApplyLB, clusterCall, clusterEvalQ,
clusterExport, clusterMap, parApply, parCapply, parLapply,
parLapplyLB, parRapply, parSapply, parSapplyLB
The following objects are masked from 'package:stats':
IQR, mad, xtabs
The following objects are masked from 'package:base':
Filter, Find, Map, Position, Reduce, anyDuplicated, append,
as.data.frame, cbind, colnames, do.call, duplicated, eval, evalq,
get, grep, grepl, intersect, is.unsorted, lapply, lengths, mapply,
match, mget, order, paste, pmax, pmax.int, pmin, pmin.int, rank,
rbind, rownames, sapply, setdiff, sort, table, tapply, union,
unique, unsplit
Welcome to Bioconductor
Vignettes contain introductory material; view with
'browseVignettes()'. To cite Bioconductor, see
'citation("Biobase")', and for packages 'citation("pkgname")'.
> png(filename="/home/ddbj/snapshot/RGM3/R_BC/result/destiny/find.sigmas.Rd_%03d_medium.png", width=480, height=480)
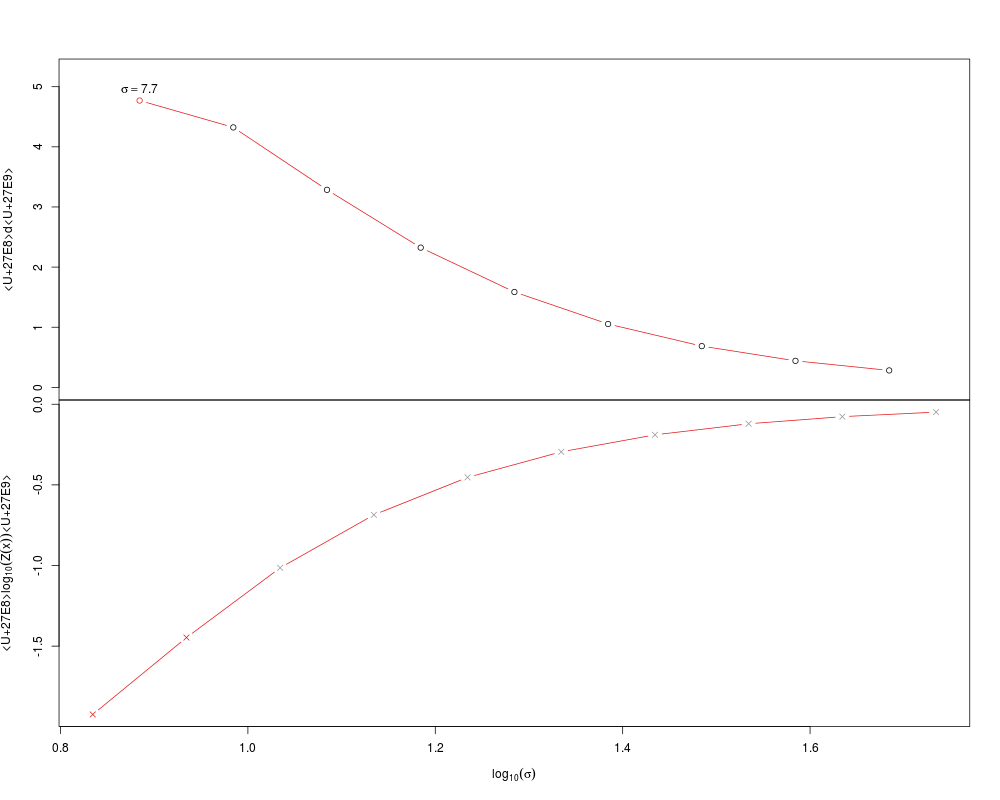
> ### Name: find.sigmas
> ### Title: Calculate the average dimensionality for m different gaussian
> ### kernel widths (sigma).
> ### Aliases: find.sigmas
>
> ### ** Examples
>
> data(guo)
> sigs <- find.sigmas(guo, verbose = TRUE)
min.dist start step.size
6.8302965 0.8344396 0.1000000
| | | 0% | |========= | 12% | |================== | 25% | |========================== | 38% | |=================================== | 50% | |============================================ | 62% | |==================================================== | 75% | |============================================================= | 88% | |======================================================================| 100%
> DiffusionMap(guo, sigs)
DiffusionMap (20 Diffusion components and 428 samples)
eigenvalues: num [1:20] 0.91 0.809 0.704 0.67 0.607 ...
eigenvectors: num [1:428, 1:20] 0.158 0.154 0.14 0.125 0.131 ...
..colnames: chr [1:20] "DC1" "DC2" "DC3" "DC4" ...
optimal.sigma: 7.66371869852767
>
>
>
>
>
>
> dev.off()
null device
1
>
 .
.