Diffusion components (eigenvectors) to plot (default: first three components; 1:3)
new.dcs
An optional matrix also containing the rows specified with y and plotted. (default: no more points)
col
Single color string or vector of discrete or categoric values to be mapped to colors.
E.g. a column of the data matrix used for creation of the diffusion map. (default: par('fg'))
col.by
Specify a dataset(x) or phenoData(dataset(x)) column to use as color
col.limits
If col is a continuous (=double) vector, this can be overridden to map the color range differently than from min to max (e.g. specify c(0, 1))
col.new
If new.dcs is given, it will take on this color. (default: red)
pal
Palette used to map the col vector to colors (default: palette())
...
Parameters passed to plot, scatterplot3d, or plot3d (if interactive == TRUE)
mar
Bottom, left, top, and right margins (default: par(mar))
ticks
logical. If TRUE, show axis ticks (default: FALSE)
axes
logical. If TRUE, draw plot axes (default: Only if tick.marks is TRUE)
box
logical. If TRUE, draw plot frame (default: TRUE or the same as axes if specified)
legend.main
Title of legend. (default: nothing unless col.by is given)
legend.opts
Other colorlegend options (default: empty list)
interactive
Use plot3d to plot instead of scatterplot3d?
draw.legend
logical. If TRUE, draw color legend (default: TRUE if col is given and a vector to be mapped)
consec.col
If col or col.by refers to an integer column, with gaps (e.g. c(5,0,0,3)) use the palette color consecutively (e.g. c(3,1,1,2))
Details
If you specify negative numbers as diffusion components (e.g. plot(dm, c(-1,2))), then the corresponding components will be flipped.
Value
The return value of the underlying call is returned, i.e. a scatterplot3d or rgl object.
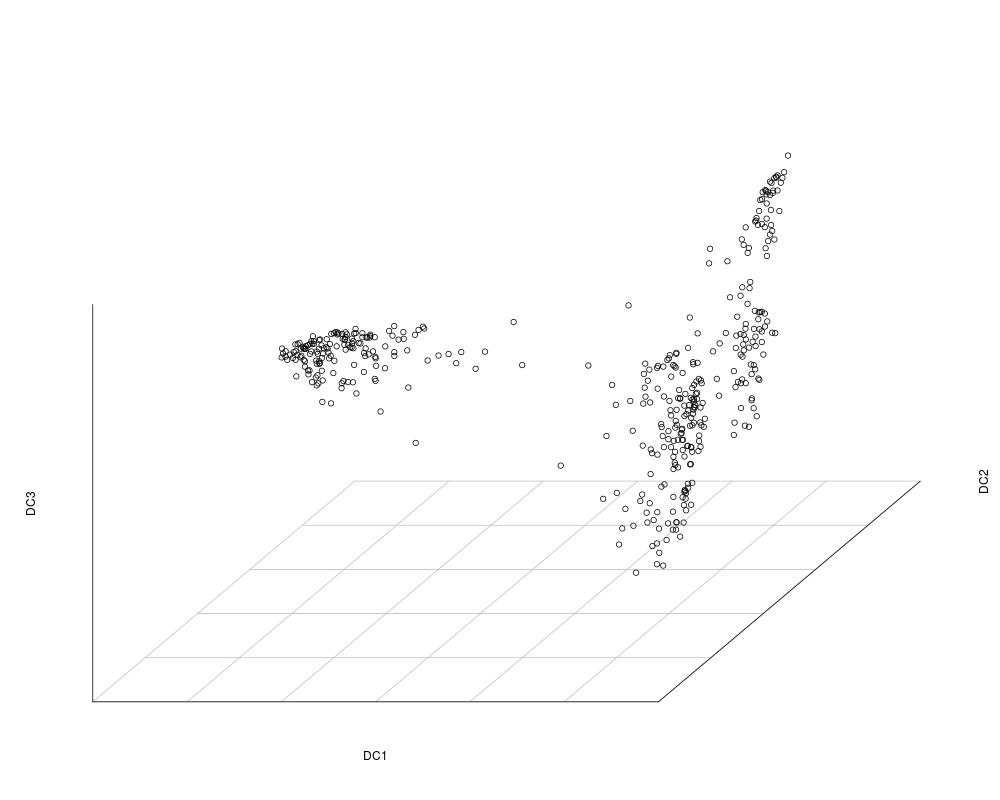
Examples
data(guo)
plot(DiffusionMap(guo))
Results
R version 3.3.1 (2016-06-21) -- "Bug in Your Hair"
Copyright (C) 2016 The R Foundation for Statistical Computing
Platform: x86_64-pc-linux-gnu (64-bit)

R is free software and comes with ABSOLUTELY NO WARRANTY.
You are welcome to redistribute it under certain conditions.
Type 'license()' or 'licence()' for distribution details.

R is a collaborative project with many contributors.
Type 'contributors()' for more information and
'citation()' on how to cite R or R packages in publications.

Type 'demo()' for some demos, 'help()' for on-line help, or
'help.start()' for an HTML browser interface to help.
Type 'q()' to quit R.

> library(destiny)
Loading required package: Biobase
Loading required package: BiocGenerics
Loading required package: parallel

Attaching package: 'BiocGenerics'

The following objects are masked from 'package:parallel':

    clusterApply, clusterApplyLB, clusterCall, clusterEvalQ,
    clusterExport, clusterMap, parApply, parCapply, parLapply,
    parLapplyLB, parRapply, parSapply, parSapplyLB

The following objects are masked from 'package:stats':

    IQR, mad, xtabs

The following objects are masked from 'package:base':

    Filter, Find, Map, Position, Reduce, anyDuplicated, append,
    as.data.frame, cbind, colnames, do.call, duplicated, eval, evalq,
    get, grep, grepl, intersect, is.unsorted, lapply, lengths, mapply,
    match, mget, order, paste, pmax, pmax.int, pmin, pmin.int, rank,
    rbind, rownames, sapply, setdiff, sort, table, tapply, union,
    unique, unsplit

Welcome to Bioconductor

    Vignettes contain introductory material; view with
    'browseVignettes()'. To cite Bioconductor, see
    'citation("Biobase")', and for packages 'citation("pkgname")'.

> png(filename="/home/ddbj/snapshot/RGM3/R_BC/result/destiny/plot.DiffusionMap.Rd_%03d_medium.png", width=480, height=480)
> ### Name: plot.DiffusionMap
> ### Title: 3D or 2D plot of diffusion map
> ### Aliases: plot,DiffusionMap,missing-method
> ###   plot,DiffusionMap,numeric-method plot.DiffusionMap
>
> ### ** Examples
>
> data(guo)
> plot(DiffusionMap(guo))
>
>
>
>
>
>
> dev.off()
null device
          1
>
 .
.