## S4 method for signature 'Sigmas,missing'
plot(x, col = par("fg"),
  highlight.col = "#E41A1C", line.col = "#999999", type = c("b", "b"),
  pch = c(par("pch"), 4L), only.dim = FALSE, ..., xlab = NULL,
  ylab = NULL, main = "")
Arguments
x
Sigmas object to plot
col
Vector of bar colors or single color for all bars
highlight.col
Color for highest bar. Overrides col
line.col
Color for the line and its axis
type
Plot type of both lines. Can be a vector of length 2 to specify both separately (default: 'b' aka “both lines and points”)
pch
Point identifier for both lines. Can be a vector of length 2 to specify both separately (default: par(pch) and 4 (a ‘\times’))
only.dim
logical. If TRUE, only plot the derivative line
...
Options passed to the call to plot
xlab
X label. NULL to use default
ylab
Either one y label or y labels for both plots. NULL to use both defauts, a NULL in a list of length 2 to use one default.
main
Title of the plot
Value
This method plots a Sigma object to the current device and returns nothing/NULL
Examples
data(guo)
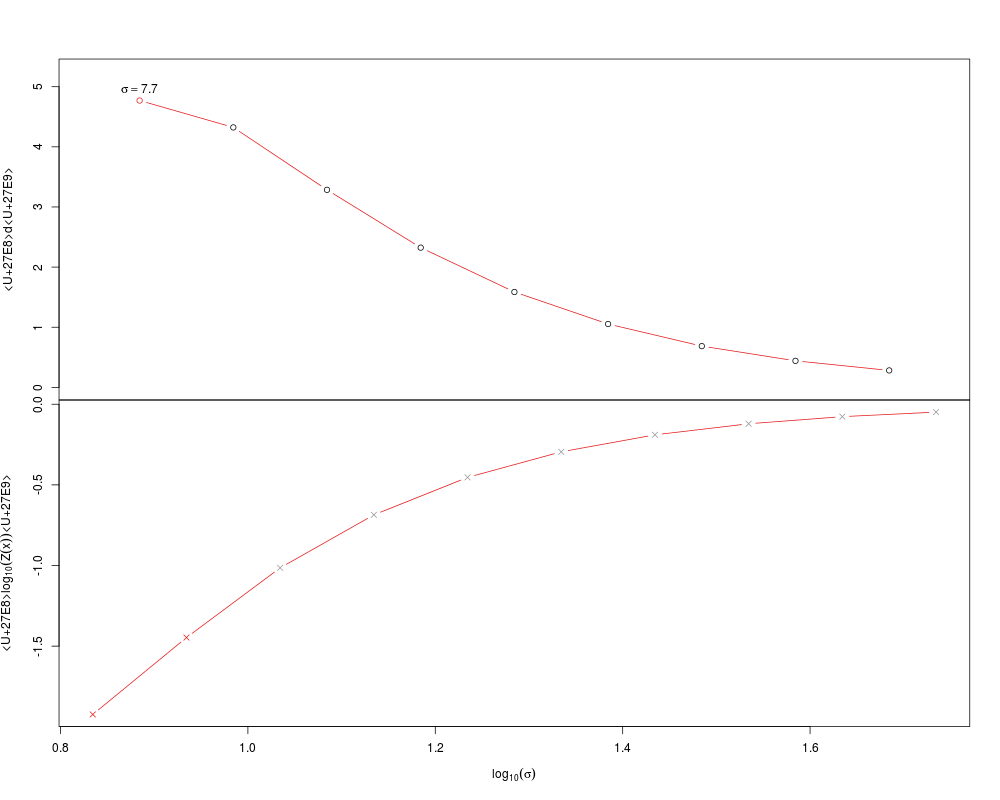
sigs <- find.sigmas(guo)
plot(sigs)
Results
R version 3.3.1 (2016-06-21) -- "Bug in Your Hair"
Copyright (C) 2016 The R Foundation for Statistical Computing
Platform: x86_64-pc-linux-gnu (64-bit)

R is free software and comes with ABSOLUTELY NO WARRANTY.
You are welcome to redistribute it under certain conditions.
Type 'license()' or 'licence()' for distribution details.

R is a collaborative project with many contributors.
Type 'contributors()' for more information and
'citation()' on how to cite R or R packages in publications.

Type 'demo()' for some demos, 'help()' for on-line help, or
'help.start()' for an HTML browser interface to help.
Type 'q()' to quit R.

> library(destiny)
Loading required package: Biobase
Loading required package: BiocGenerics
Loading required package: parallel

Attaching package: 'BiocGenerics'

The following objects are masked from 'package:parallel':

    clusterApply, clusterApplyLB, clusterCall, clusterEvalQ,
    clusterExport, clusterMap, parApply, parCapply, parLapply,
    parLapplyLB, parRapply, parSapply, parSapplyLB

The following objects are masked from 'package:stats':

    IQR, mad, xtabs

The following objects are masked from 'package:base':

    Filter, Find, Map, Position, Reduce, anyDuplicated, append,
    as.data.frame, cbind, colnames, do.call, duplicated, eval, evalq,
    get, grep, grepl, intersect, is.unsorted, lapply, lengths, mapply,
    match, mget, order, paste, pmax, pmax.int, pmin, pmin.int, rank,
    rbind, rownames, sapply, setdiff, sort, table, tapply, union,
    unique, unsplit

Welcome to Bioconductor

    Vignettes contain introductory material; view with
    'browseVignettes()'. To cite Bioconductor, see
    'citation("Biobase")', and for packages 'citation("pkgname")'.

> png(filename="/home/ddbj/snapshot/RGM3/R_BC/result/destiny/plot.Sigmas.Rd_%03d_medium.png", width=480, height=480)
> ### Name: plot.Sigmas
> ### Title: Plot Sigmas object
> ### Aliases: plot,Sigmas,missing-method plot.Sigmas
>
> ### ** Examples
>
> data(guo)
> sigs <- find.sigmas(guo)
 min.dist     start step.size
6.8302965 0.8344396 0.1000000
   |                                                                               |                                                                      |   0%   |                                                                               |=========                                                             |  12%   |                                                                               |==================                                                    |  25%   |                                                                               |==========================                                            |  38%   |                                                                               |===================================                                   |  50%   |                                                                               |============================================                          |  62%   |                                                                               |====================================================                  |  75%   |                                                                               |=============================================================         |  88%   |                                                                               |======================================================================| 100%
> plot(sigs)
>
>
>
>
>
>
> dev.off()
null device
          1
>
 .
.