Supported by Dr. Osamu Ogasawara and  . . |
|
Last data update: 2014.03.03 |
Plot channel values against timeDescriptionPlots values of one parameter for each flowFrame in a flowSet against time. Usage
timelineplot(x, channel, type = c("stacked", "scaled", "native", "frequency"),
  col, ylab = names(x), binSize, varCut = 1, ...)

## S4 method for signature 'flowSet,character'
timeLinePlot(x, channel, type = c("stacked",
  "scaled", "native", "frequency"), col = NULL, ylab = sampleNames(x),
  binSize, varCut = 1, ...)

## S4 method for signature 'flowFrame,character'
timeLinePlot(x, channel, ...)

## S4 method for signature 'ANY,missing'
timeLinePlot(x, channel, ...)
Arguments
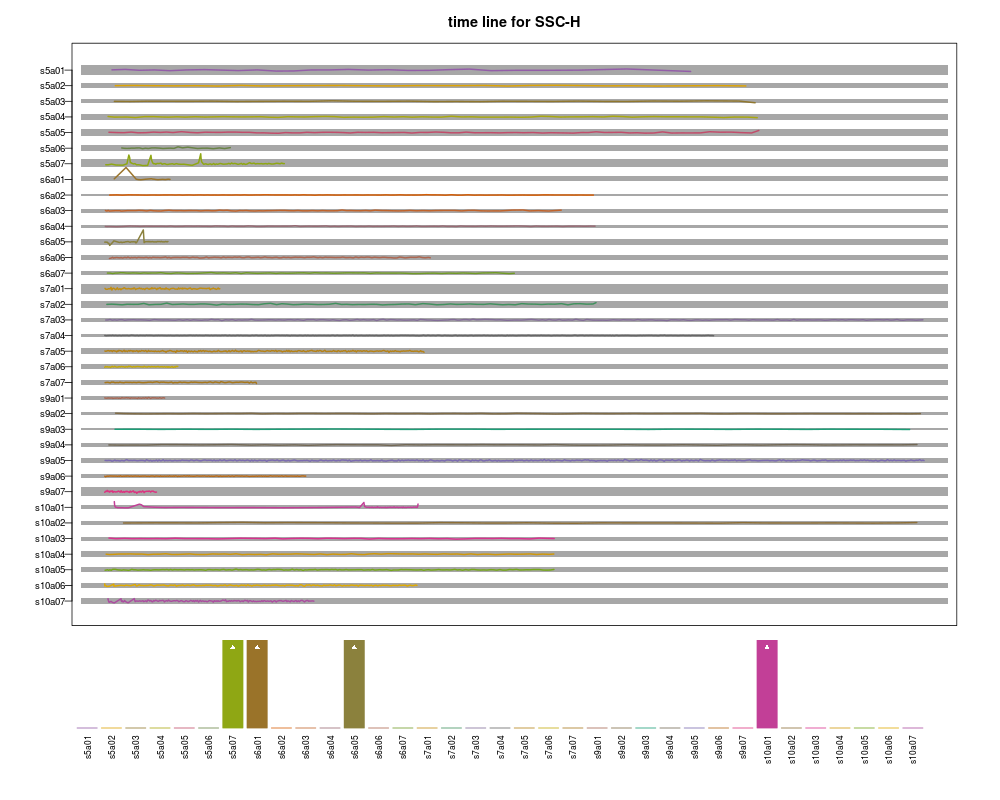
DetailsPlotting flow cytometry data against the time domain can help to identify problems with the fluidics or drifts in the instrument setting during measurement runs. This function creates plots for all flowFrames in a flowSet for a given parameter against time. A barplot legend indicates the deviation from the median for each sample. There is also a flowFrame method, which will create a plot for a single flowFrame only. In addition, the function computes a quality score for each frame, which essentially is the sum of the positive distances of each bin mean from a frame-specific confidence interval, divided by the number of bins. Values larger than zero indicate a problem. ValueA numeric vector of quality scores. Author(s)F. Hahne See Also
Examplesdata(GvHD) opar <- par(ask=TRUE) res <- timeLinePlot(GvHD[[1]], "SSC-H") res res <- timeLinePlot(GvHD, "SSC-H") res <- timeLinePlot(GvHD, "SSC-H", type="scaled", varCut=4) res <- timeLinePlot(GvHD[1:4], "SSC-H", type="native", binSize=50) par(opar) Results
R version 3.3.1 (2016-06-21) -- "Bug in Your Hair"
Copyright (C) 2016 The R Foundation for Statistical Computing
Platform: x86_64-pc-linux-gnu (64-bit)

R is free software and comes with ABSOLUTELY NO WARRANTY.
You are welcome to redistribute it under certain conditions.
Type 'license()' or 'licence()' for distribution details.

R is a collaborative project with many contributors.
Type 'contributors()' for more information and
'citation()' on how to cite R or R packages in publications.

Type 'demo()' for some demos, 'help()' for on-line help, or
'help.start()' for an HTML browser interface to help.
Type 'q()' to quit R.

> library(flowViz)
Loading required package: flowCore
Loading required package: lattice
> png(filename="/home/ddbj/snapshot/RGM3/R_BC/result/flowViz/timeLinePlot.Rd_%03d_medium.png", width=480, height=480)
> ### Name: timeLinePlot
> ### Title: Plot channel values against time
> ### Aliases: timeLinePlot timeLinePlot,ANY,missing-method
> ###   timeLinePlot,flowFrame,character-method
> ###   timeLinePlot,flowSet,character-method timelineplot
> ### Keywords: dplot methods
>
> ### ** Examples
>
> data(GvHD)
> opar <- par(ask=TRUE)
>
> res <- timeLinePlot(GvHD[[1]], "SSC-H")
> res
[1] 20.37149
>
> res <- timeLinePlot(GvHD, "SSC-H")
>
> res <- timeLinePlot(GvHD, "SSC-H", type="scaled", varCut=4)
>
> res <- timeLinePlot(GvHD[1:4], "SSC-H", type="native", binSize=50)
>
> par(opar)
>
>
>
>
>
> dev.off()
null device
          1
>
|