ExpressionSet or Matrix. Gene expression of the samples.
genes
Vector or Matrix. IDs of the genes to plot.
If matrix: genes should be ordered by classes. Columns should be named after the classes. If not provided, all available genes will be plot.
Warning: If a list of genes is not provided, it will plot all available genes.
fileName
Character. File name to save the plots. If not provided, up to 20 genes will be shown on screen.
geneLabels
Vector or Matrix. Gene name, ID or label which should be shown in the returned results and plots.
type
Character. Plot type: "lines" or "boxplot".
sampleLabels
Character. PhenoData variable (column name) containing the train samples class labels.
Matrix or Factor. Class labels of the train samples.
sampleColors
Character. Colors for the lines of the samples.
labelsOrder
Vector or Factor. Order in which the labels should be shown in the returned results and plots.
classColors
Character. Colors for each of the classes or samples of the class. Provide either sampleColors or classColors, not both.
sameScale
Logical. If TRUE, plots all the genes in the same expression scale.
showSampleNames
Logical. If TRUE, the sample names are shown in the plot. Not recommended for big datasets.
showMean
Logical. If TRUE, plots the class expression mean.
identify
Logical. If TRUE and supported (X11 or quartz devices), the plot will be interactive and clicking on a point will identify the sample the point represents. Press ESC or right-click on the plot screen to exit.
verbose
Logical. If TRUE, a message indicating where the pdf is saved will be printed on screen.
Value
The expression profiles plot, saved in the working directory as 'fileName.pdf'.
Author(s)
Bioinformatics and Functional Genomics Group. Centro de Investigacion del Cancer (CIC-IBMCC, USAL-CSIC). Salamanca. Spain
Examples
######
# Load libraries and expression data
######
# Load an expressionSet:
library(leukemiasEset)
data(leukemiasEset)
######
# Generic expression profile plot
######
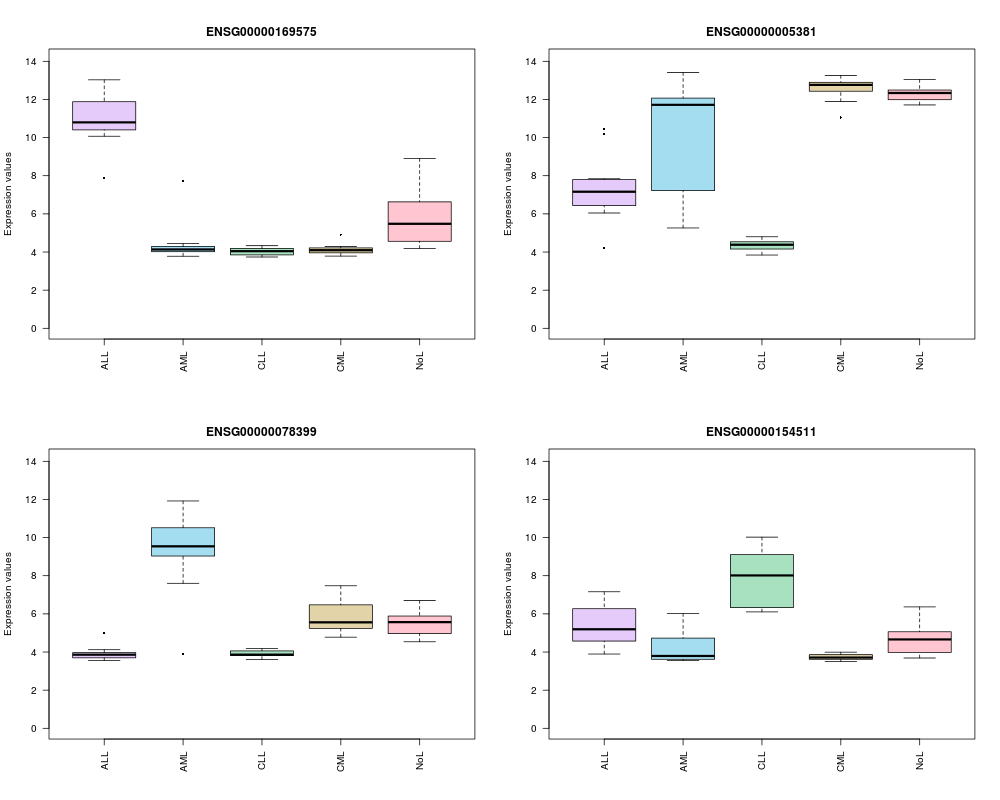
# Plot expression of specific genes:
selectedGenes <- c("ENSG00000169575","ENSG00000078399","ENSG00000005381","ENSG00000154511")
plotExpressionProfiles(leukemiasEset, genes=selectedGenes, sampleLabels="LeukemiaType", type="boxplot")
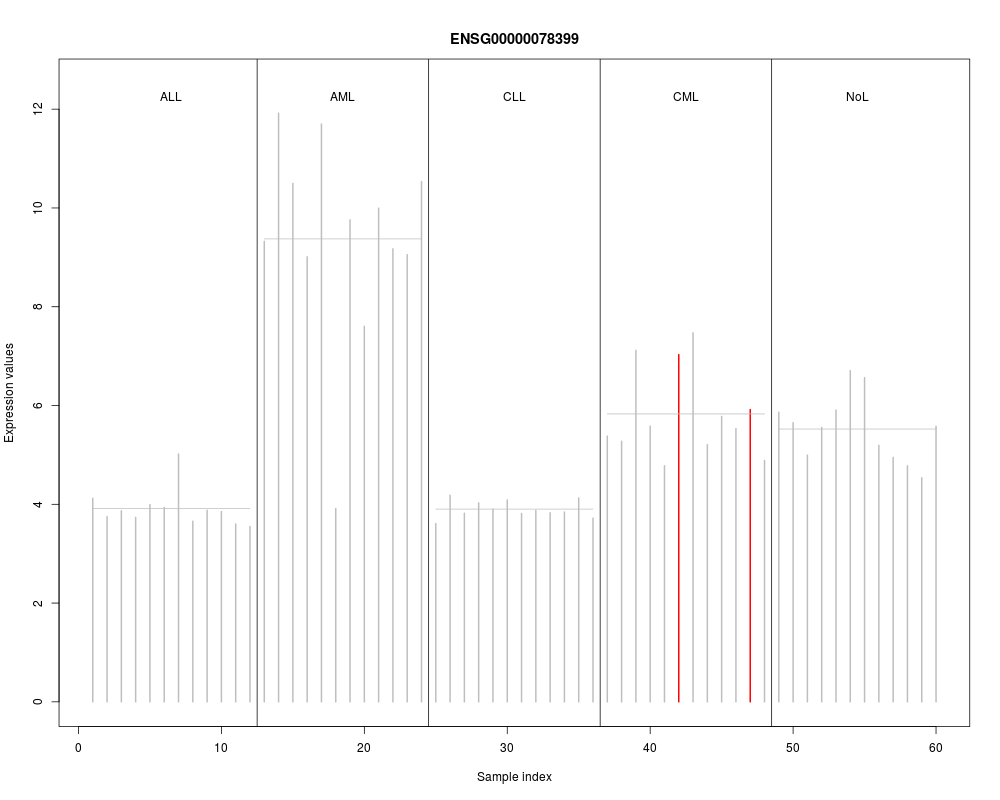
# Color samples:
plotExpressionProfiles(leukemiasEset, genes="ENSG00000078399",
sampleLabels="LeukemiaType",
showMean=TRUE, identify=FALSE,
sampleColors=c("grey","red")
[(sampleNames(leukemiasEset) %in% c("GSM331386.CEL","GSM331392.CEL"))+1])
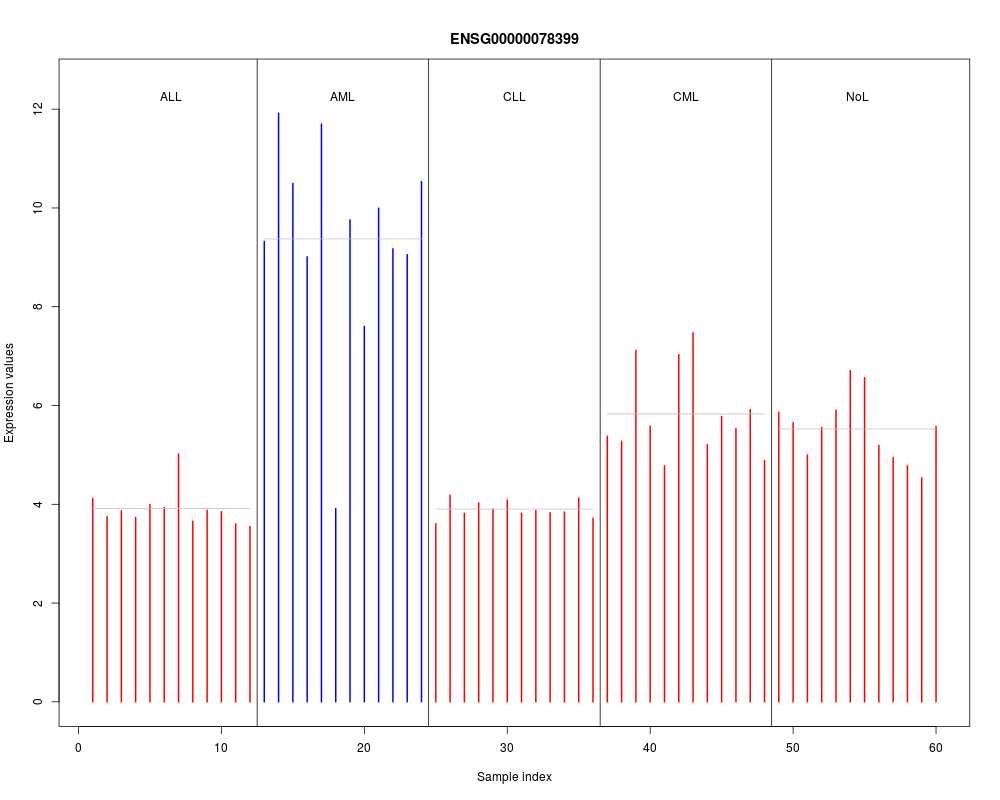
# Color classes:
plotExpressionProfiles(leukemiasEset, genes="ENSG00000078399",
sampleLabels="LeukemiaType",
showMean=TRUE, identify=TRUE,
classColors=c("red", "blue", "red", "red","red"))
######
# Expression profiles related to a classifier
######
# Train a classifier or load a trained one:
trainSamples<- c(1:10, 13:22, 25:34, 37:46, 49:58)
# summary(leukemiasEset$LeukemiaType[trainSamples])
# leukemiasClassifier <- geNetClassifier(leukemiasEset[,trainSamples],
# sampleLabels="LeukemiaType", plotsName="leukemiasClassifier")
data(leukemiasClassifier) # Sample trained classifier
# Plot expression of the selected genes in the train samples:
plotExpressionProfiles(leukemiasEset[,trainSamples], leukemiasClassifier,
sampleLabels="LeukemiaType", fileName="leukExprs.pdf")
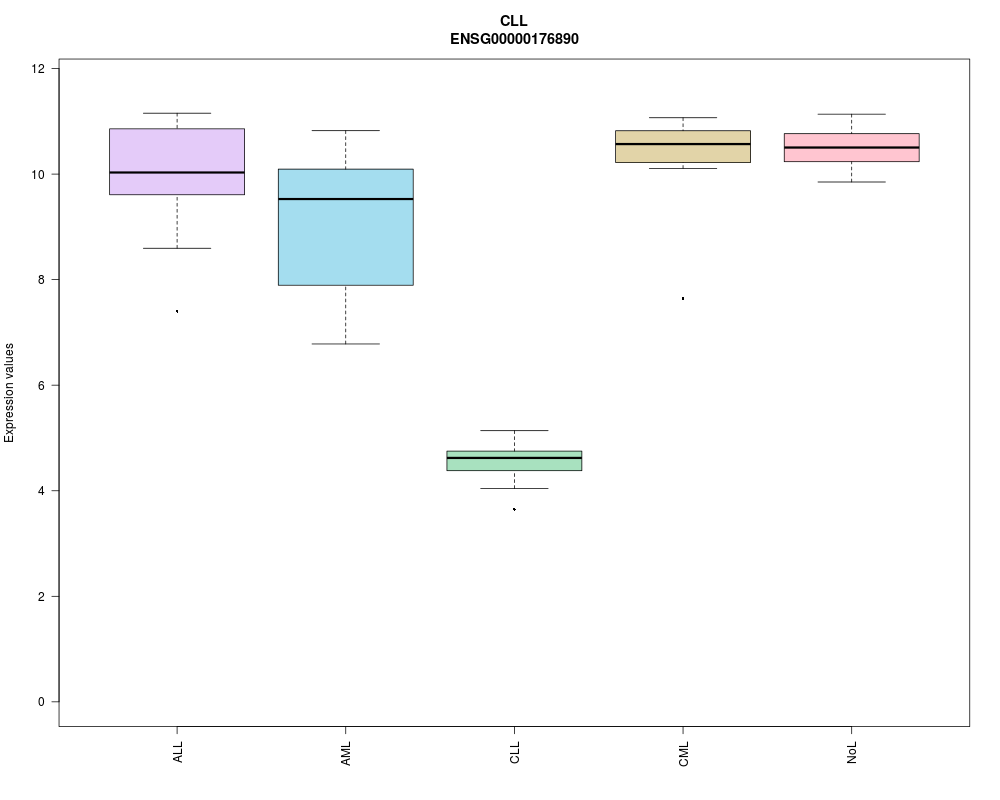
# Plot expression of all the genes of specific classes:
classGenes <- getRanking(leukemiasClassifier@classificationGenes,
showGeneID=TRUE)$geneID[,c("CLL"), drop=FALSE] # Feel free to modify
plotExpressionProfiles(leukemiasEset, genes=classGenes, sampleLabels="LeukemiaType",
type="boxplot")
# Plot (on screen) the expression of the top ranked genes of each class
plotExpressionProfiles(leukemiasEset, leukemiasClassifier, sampleLabels="LeukemiaType")
Results
R version 3.3.1 (2016-06-21) -- "Bug in Your Hair"
Copyright (C) 2016 The R Foundation for Statistical Computing
Platform: x86_64-pc-linux-gnu (64-bit)

R is free software and comes with ABSOLUTELY NO WARRANTY.
You are welcome to redistribute it under certain conditions.
Type 'license()' or 'licence()' for distribution details.

R is a collaborative project with many contributors.
Type 'contributors()' for more information and
'citation()' on how to cite R or R packages in publications.

Type 'demo()' for some demos, 'help()' for on-line help, or
'help.start()' for an HTML browser interface to help.
Type 'q()' to quit R.

> library(geNetClassifier)
Loading required package: Biobase
Loading required package: BiocGenerics
Loading required package: parallel

Attaching package: 'BiocGenerics'

The following objects are masked from 'package:parallel':

    clusterApply, clusterApplyLB, clusterCall, clusterEvalQ,
    clusterExport, clusterMap, parApply, parCapply, parLapply,
    parLapplyLB, parRapply, parSapply, parSapplyLB

The following objects are masked from 'package:stats':

    IQR, mad, xtabs

The following objects are masked from 'package:base':

    Filter, Find, Map, Position, Reduce, anyDuplicated, append,
    as.data.frame, cbind, colnames, do.call, duplicated, eval, evalq,
    get, grep, grepl, intersect, is.unsorted, lapply, lengths, mapply,
    match, mget, order, paste, pmax, pmax.int, pmin, pmin.int, rank,
    rbind, rownames, sapply, setdiff, sort, table, tapply, union,
    unique, unsplit

Welcome to Bioconductor

    Vignettes contain introductory material; view with
    'browseVignettes()'. To cite Bioconductor, see
    'citation("Biobase")', and for packages 'citation("pkgname")'.

Loading required package: EBarrays
Loading required package: lattice
Loading required package: minet
> png(filename="/home/ddbj/snapshot/RGM3/R_BC/result/geNetClassifier/plotExpressionProfiles.Rd_%03d_medium.png", width=480, height=480)
> ### Name: plotExpressionProfiles
> ### Title: Expression profiles plot.
> ### Aliases: plotExpressionProfiles
> ### Keywords: classif
>
> ### ** Examples
>
> ######
> # Load libraries and expression data
> ######
>
> # Load an expressionSet:
> library(leukemiasEset)
> data(leukemiasEset)
>
> ######
> # Generic expression profile plot
> ######
> # Plot expression of specific genes:
> selectedGenes <- c("ENSG00000169575","ENSG00000078399","ENSG00000005381","ENSG00000154511")
> plotExpressionProfiles(leukemiasEset, genes=selectedGenes, sampleLabels="LeukemiaType", type="boxplot")
>
> # Color samples:
> plotExpressionProfiles(leukemiasEset, genes="ENSG00000078399",
+  sampleLabels="LeukemiaType",
+  showMean=TRUE, identify=FALSE,
+  sampleColors=c("grey","red")
+  [(sampleNames(leukemiasEset) %in% c("GSM331386.CEL","GSM331392.CEL"))+1])
>
> # Color classes:
> plotExpressionProfiles(leukemiasEset, genes="ENSG00000078399",
+  sampleLabels="LeukemiaType",
+  showMean=TRUE, identify=TRUE,
+  classColors=c("red", "blue", "red", "red","red"))
[1] "To identify a sample on the plot click on it. Press ESC or  right-click on the plot screen to finish."
integer(0)
>
> ######
> # Expression profiles related to a classifier
> ######
> # Train a classifier or load a trained one:
> trainSamples<- c(1:10, 13:22, 25:34, 37:46, 49:58)
> # summary(leukemiasEset$LeukemiaType[trainSamples])
> # leukemiasClassifier <- geNetClassifier(leukemiasEset[,trainSamples],
> #    sampleLabels="LeukemiaType", plotsName="leukemiasClassifier")
> data(leukemiasClassifier) # Sample trained classifier
>
> # Plot expression of the selected genes in the train samples:
> plotExpressionProfiles(leukemiasEset[,trainSamples], leukemiasClassifier,
+     sampleLabels="LeukemiaType", fileName="leukExprs.pdf")
The plot was saved as /home/ddbj/DataUpdator-rgm3/target/leukExprs.pdf (PDF file)
Warning message:
In plotExpressionProfiles(leukemiasEset[, trainSamples], leukemiasClassifier,  :
  Plotting expression profiles of the classification genes. To plot other genes, set i.e. genes=...@genesRanking
>
> # Plot expression of all the genes of specific classes:
> classGenes <- getRanking(leukemiasClassifier@classificationGenes,
+     showGeneID=TRUE)$geneID[,c("CLL"), drop=FALSE] # Feel free to modify
> plotExpressionProfiles(leukemiasEset, genes=classGenes, sampleLabels="LeukemiaType",
+     type="boxplot")
>
> # Plot (on screen) the expression of the top ranked genes of each class
> plotExpressionProfiles(leukemiasEset, leukemiasClassifier, sampleLabels="LeukemiaType")
Warning messages:
1: In plotExpressionProfiles(leukemiasEset, leukemiasClassifier, sampleLabels = "LeukemiaType") :
  Plotting expression profiles of the classification genes. To plot other genes, set i.e. genes=...@genesRanking
2: In plotExpressionProfiles(leukemiasEset, leukemiasClassifier, sampleLabels = "LeukemiaType") :
  Up to 20 genes will be shown. To plot more genes specify a PDF output file name.
>
>
>
>
>
>
> dev.off()
null device
          1
>
 .
.