R: Generate a heatmap showing log2 odds ratios and P-values.
plotConCub
R Documentation
Generate a heatmap showing log2 odds ratios and P-values.
Description
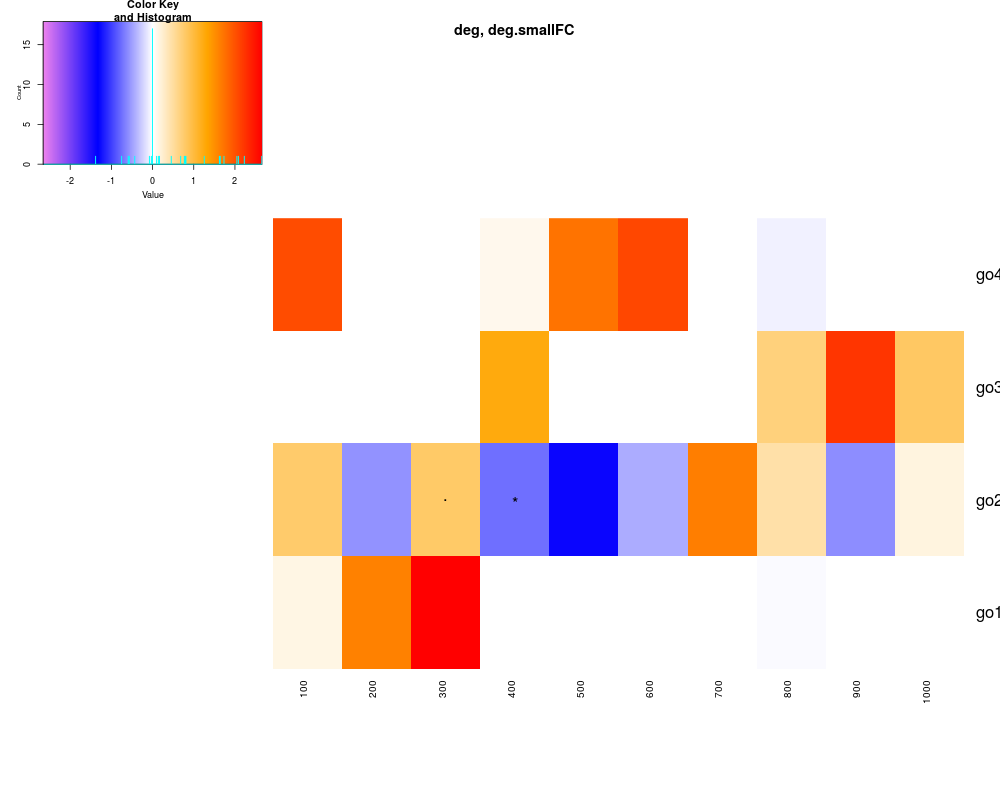
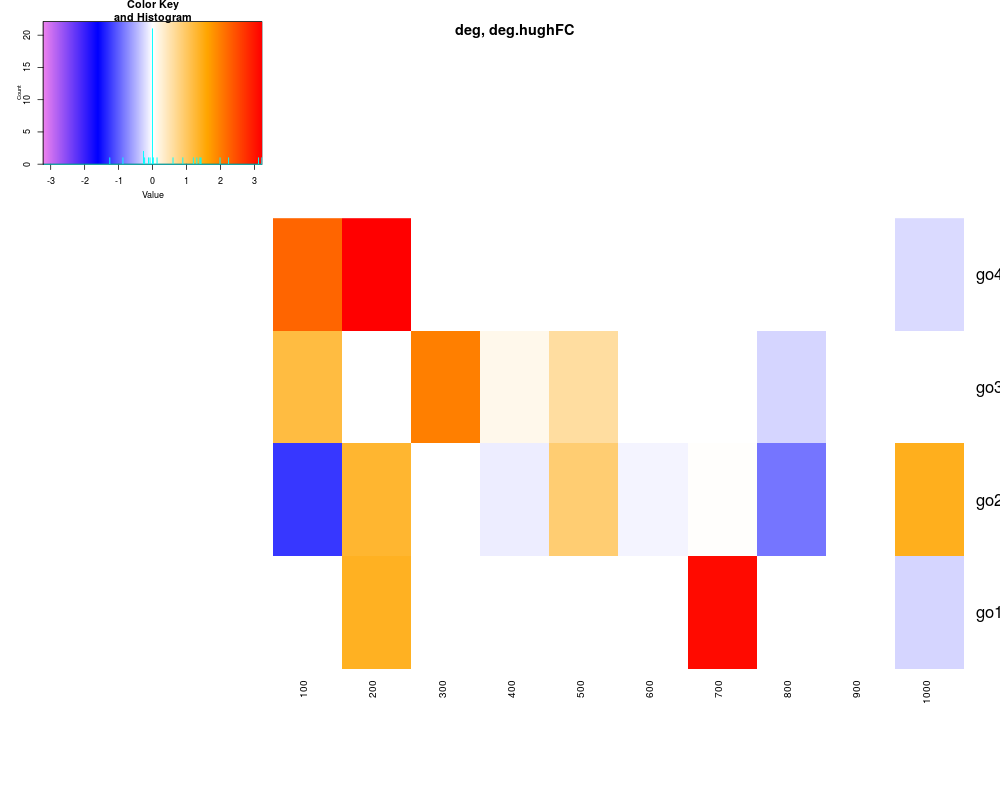
The function generates a heatmap by calling the heatmap.2-function from the gplots-package. Each cell shows the log2 odds ratio of the test for the corresponding variables. In addition, stars indicate the P-value for this test.
The heatmap can only visualize a two-dimensional table. In case of three-dimensions, one dimension (category) must be fixed.
show
A named list. The names are the names of the categories. Each item is a character vector of variables that should be shown in the plot.
dontshow
A named list. The names are the names of the categories. Each item is a character vector of variables that should not be shown in the plot.
args_heatmap.2
Arguments passed to ‘heatmap.2’. Can be used to change size of fonts etc.
col
A vector of colors, for instance from heat.colors
alt.names
Substitute variables by alternative terms. For instance, if variables are artificial ids, they can be substituted by descriptive text for the heatmap.
t
logical; transpose matrix for heatmap. Default FALSE.
Examples
##
## a completely artificial example run
## through the routines of the package
##
R <- 500
#generate R random gene-ids
ID <- sapply(1:R, function(r){paste( sample(LETTERS, 10), collapse="" ) } )
ID <- unique(ID)

#assign artificial differentially expressed genes randomly
category1 <- list( deg.smallFC=sample(ID, 100, rep=FALSE),
	deg.hughFC=sample(ID, 100, rep=FALSE) )
#assign artificial GO terms of genes randomly
category2 <- list( go1=sample(ID, 50, replace=FALSE),
	go2=sample(ID, 166, replace=FALSE),
	go3=sample(ID, 74, replace=FALSE),
	go4=sample(ID, 68, replace=FALSE) )
#assign artificial sequence length of genes randomly
LEN <- setNames(sample(seq(100, 1000, 100), length(ID), replace=TRUE), ID)
category3 <- split( ID, f=factor(LEN, levels=seq(100, 1000, 100)) )
CatList <- list(deg=category1, go=category2, len=category3)

ConCubFilter.obj <- new("concubfilter", names=names(CatList))
ConCub.obj <- new("concub", fact=CatList)
ConCub.obj.2 <- runConCub( obj=ConCub.obj, filter=ConCubFilter.obj, nthreads=1 )
ConCub.obj.3 <- filterConCub( obj=ConCub.obj.2, filter=ConCubFilter.obj )
plotConCub( obj=ConCub.obj.3, filter=ConCubFilter.obj )
Results
R version 3.3.1 (2016-06-21) -- "Bug in Your Hair"
Copyright (C) 2016 The R Foundation for Statistical Computing
Platform: x86_64-pc-linux-gnu (64-bit)

R is free software and comes with ABSOLUTELY NO WARRANTY.
You are welcome to redistribute it under certain conditions.
Type 'license()' or 'licence()' for distribution details.

R is a collaborative project with many contributors.
Type 'contributors()' for more information and
'citation()' on how to cite R or R packages in publications.

Type 'demo()' for some demos, 'help()' for on-line help, or
'help.start()' for an HTML browser interface to help.
Type 'q()' to quit R.

> library(geecc)
geecc 1.6.0 loaded
> png(filename="/home/ddbj/snapshot/RGM3/R_BC/result/geecc/plotConCub.Rd_%03d_medium.png", width=480, height=480)
> ### Name: plotConCub
> ### Title: Generate a heatmap showing log2 odds ratios and P-values.
> ### Aliases: plotConCub
>
> ### ** Examples
>
> ##
> ## a completely artificial example run
> ## through the routines of the package
> ##
> R <- 500
> #generate R random gene-ids
> ID <- sapply(1:R, function(r){paste( sample(LETTERS, 10), collapse="" ) } )
> ID <- unique(ID)
>
> #assign artificial differentially expressed genes randomly
> category1 <- list( deg.smallFC=sample(ID, 100, rep=FALSE),
+ 	deg.hughFC=sample(ID, 100, rep=FALSE) )
> #assign artificial GO terms of genes randomly
> category2 <- list( go1=sample(ID, 50, replace=FALSE),
+ 	go2=sample(ID, 166, replace=FALSE),
+ 	go3=sample(ID, 74, replace=FALSE),
+ 	go4=sample(ID, 68, replace=FALSE) )
> #assign artificial sequence length of genes randomly
> LEN <- setNames(sample(seq(100, 1000, 100), length(ID), replace=TRUE), ID)
> category3 <- split( ID, f=factor(LEN, levels=seq(100, 1000, 100)) )
> CatList <- list(deg=category1, go=category2, len=category3)
>
> ConCubFilter.obj <- new("concubfilter", names=names(CatList))
> ConCub.obj <- new("concub", fact=CatList)
> ConCub.obj.2 <- runConCub( obj=ConCub.obj, filter=ConCubFilter.obj, nthreads=1 )
Testing: counts ~ deg + go + len (mi)

> ConCub.obj.3 <- filterConCub( obj=ConCub.obj.2, filter=ConCubFilter.obj )
Dimension before filtering: deg=2, go=4, len=10
Dimension after filtering: deg=2, go=4, len=10
> plotConCub( obj=ConCub.obj.3, filter=ConCubFilter.obj )
>
>
>
>
>
>
> dev.off()
null device
          1
>
 .
.