Supported by Dr. Osamu Ogasawara and  . . |
|
Last data update: 2014.03.03 |
critical regionsDescriptioncritical region cutpoints UsagecritVal.target(k, p0, target, posdiff = NULL, ns) Arguments
DetailsThis version uses TFD and will find alpha implicitly Valuelist of cutoffs and attributes Author(s)Charles Berry See Also
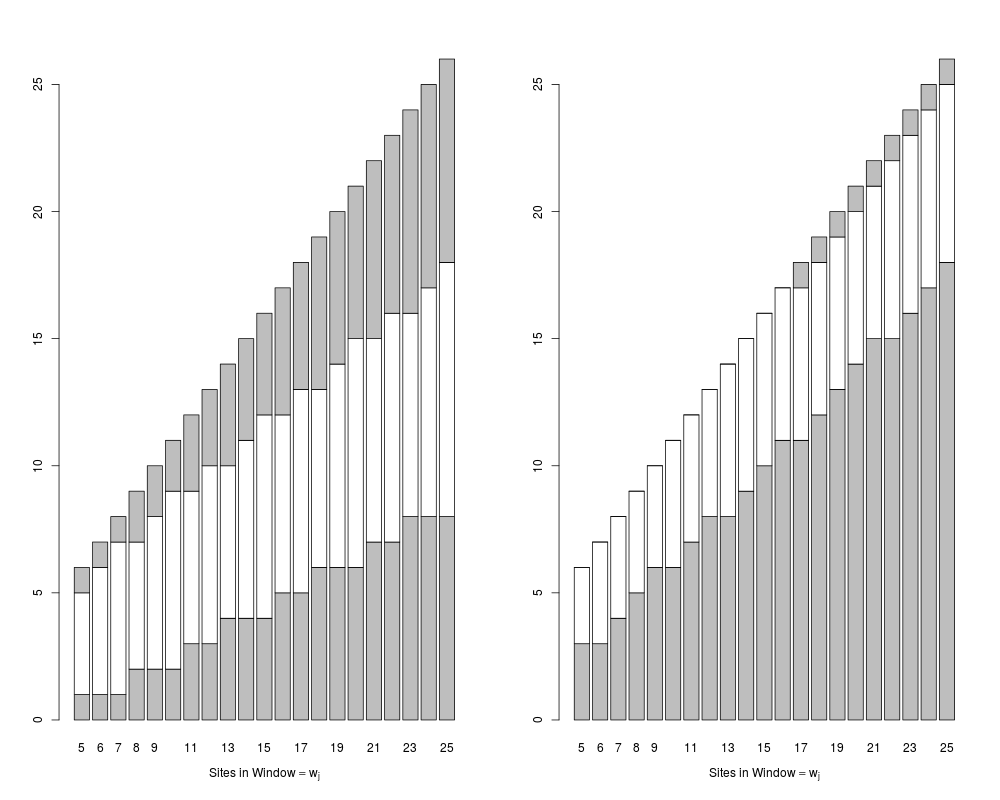
Examples# symmetric odds: crit <- critVal.target(5:25,c(1,1),1,ns=rep(10,21)) crit[[1]] sapply(crit,c) # 5:1 odds asymmetric.crit <- critVal.target(5:25,c(1,5),1,ns=rep(10,21)) # show the critical regions par(mfrow=c(1,2)) gRxPlot(crit,method="critical") gRxPlot(asymmetric.crit,method="critical") rm(crit,asymmetric.crit) Results
R version 3.3.1 (2016-06-21) -- "Bug in Your Hair"
Copyright (C) 2016 The R Foundation for Statistical Computing
Platform: x86_64-pc-linux-gnu (64-bit)

R is free software and comes with ABSOLUTELY NO WARRANTY.
You are welcome to redistribute it under certain conditions.
Type 'license()' or 'licence()' for distribution details.

R is a collaborative project with many contributors.
Type 'contributors()' for more information and
'citation()' on how to cite R or R packages in publications.

Type 'demo()' for some demos, 'help()' for on-line help, or
'help.start()' for an HTML browser interface to help.
Type 'q()' to quit R.

> library(geneRxCluster)
Loading required package: GenomicRanges
Loading required package: BiocGenerics
Loading required package: parallel

Attaching package: 'BiocGenerics'

The following objects are masked from 'package:parallel':

    clusterApply, clusterApplyLB, clusterCall, clusterEvalQ,
    clusterExport, clusterMap, parApply, parCapply, parLapply,
    parLapplyLB, parRapply, parSapply, parSapplyLB

The following objects are masked from 'package:stats':

    IQR, mad, xtabs

The following objects are masked from 'package:base':

    Filter, Find, Map, Position, Reduce, anyDuplicated, append,
    as.data.frame, cbind, colnames, do.call, duplicated, eval, evalq,
    get, grep, grepl, intersect, is.unsorted, lapply, lengths, mapply,
    match, mget, order, paste, pmax, pmax.int, pmin, pmin.int, rank,
    rbind, rownames, sapply, setdiff, sort, table, tapply, union,
    unique, unsplit

Loading required package: S4Vectors
Loading required package: stats4

Attaching package: 'S4Vectors'

The following objects are masked from 'package:base':

    colMeans, colSums, expand.grid, rowMeans, rowSums

Loading required package: IRanges
Loading required package: GenomeInfoDb
> png(filename="/home/ddbj/snapshot/RGM3/R_BC/result/geneRxCluster/critVal.target.Rd_%03d_medium.png", width=480, height=480)
> ### Name: critVal.target
> ### Title: critical regions
> ### Aliases: critVal.target
>
> ### ** Examples
>
> # symmetric odds:
> crit <- critVal.target(5:25,c(1,1),1,ns=rep(10,21))
> crit[[1]]
low  up
  1   5
attr(,"fdr")
     target.low target.hi     low      hi
[1,]      0.625    20.000 0.03125 1.00000
[2,]      3.750    19.375 0.18750 0.96875
[3,]     10.000    16.250 0.50000 0.81250
[4,]     16.250    10.000 0.81250 0.50000
[5,]     19.375     3.750 0.96875 0.18750
[6,]     20.000     0.625 1.00000 0.03125
attr(,"target")
[1] 1
> sapply(crit,c)
    [,1] [,2] [,3] [,4] [,5] [,6] [,7] [,8] [,9] [,10] [,11] [,12] [,13] [,14]
low    1    1    1    2    2    2    3    3    4     4     4     5     5     6
up     5    6    7    7    8    9    9   10   10    11    12    12    13    13
    [,15] [,16] [,17] [,18] [,19] [,20] [,21]
low     6     6     7     7     8     8     8
up     14    15    15    16    16    17    18
> # 5:1 odds
> asymmetric.crit <- critVal.target(5:25,c(1,5),1,ns=rep(10,21))
> # show the critical regions
> par(mfrow=c(1,2))
> gRxPlot(crit,method="critical")
> gRxPlot(asymmetric.crit,method="critical")
> rm(crit,asymmetric.crit)
>
>
>
>
>
> dev.off()
null device
          1
>
|
Created & Maintained by Osamu Ogasawara (osamu.ogasawara@gmail.com) and 