Supported by Dr. Osamu Ogasawara and  . . |
|
Last data update: 2014.03.03 |
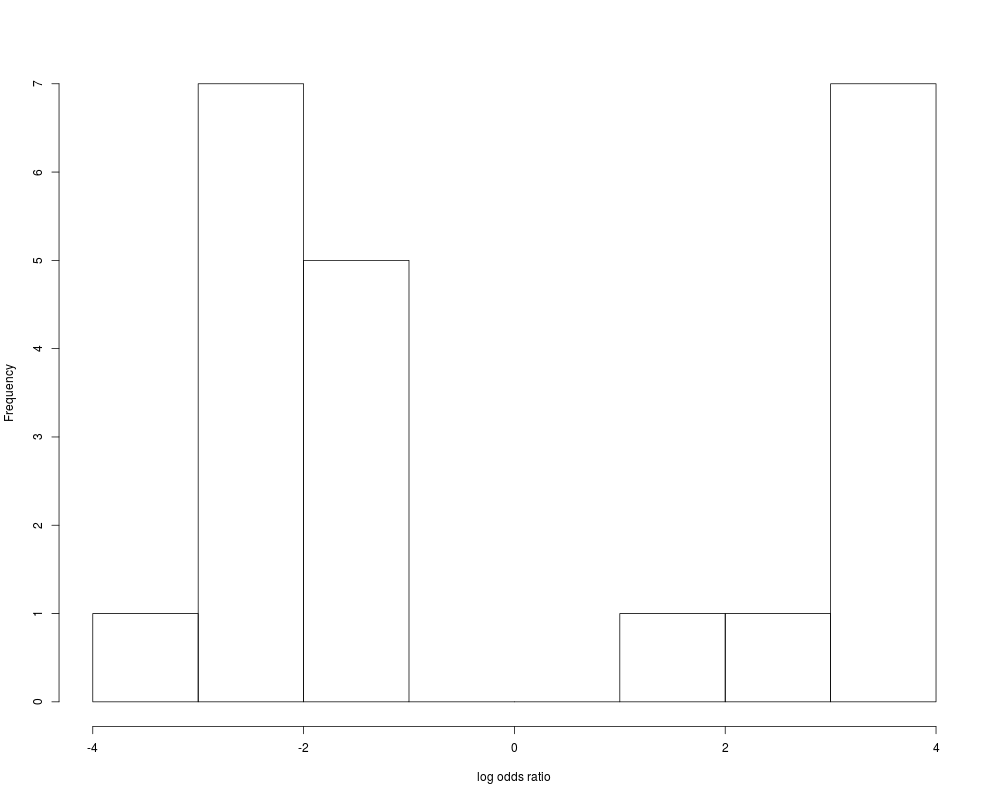
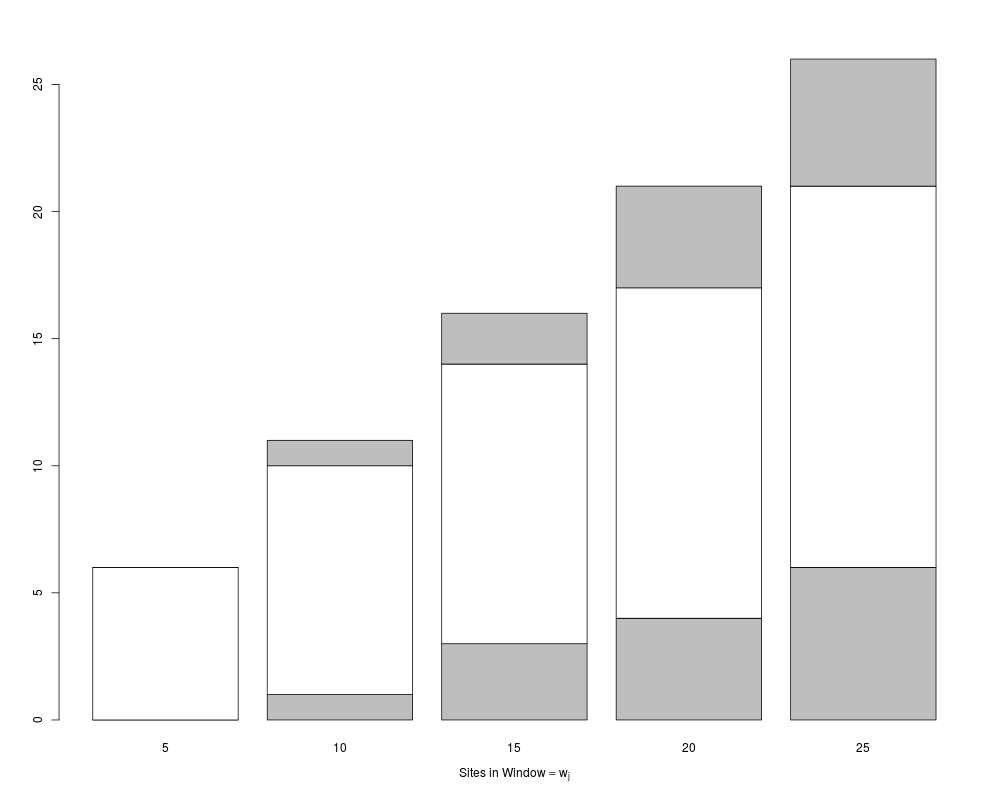
gRxPlotDescriptionPlot Clumps and/or Critical Regions Usage
gRxPlot(object, pi.0 = NULL, method = c("odds", "criticalRegions"),
  xlim = NULL, main = NULL, xlab = "log odds ratio", breaks = "Sturges",
  kvals = NULL, ...)
Arguments
DetailsThe results of a call to Valuesee Author(s)Charles Berry See Also
Examplesx.seqnames <- rep(letters[1:3],each=500) x.starts <- c(seq(1,length=500),seq(1,by=2,length=500),seq(1,by=3,length=500)) x.lens <- rep(c(5,10,15,20,25),each=20) x.group <- rep(rep(c(TRUE,FALSE),length=length(x.lens)),x.lens) ## add a bit of fuzz: x.group <- 1==rbinom(length(x.group),1,pr=ifelse(x.group,.8,.2)) x.kvals <- as.integer(sort(unique(x.lens))) x.res <- gRxCluster(x.seqnames,x.starts,x.group,x.kvals) gRxPlot(x.res) rm( x.seqnames, x.starts, x.lens, x.group, x.kvals, x.res) Results
R version 3.3.1 (2016-06-21) -- "Bug in Your Hair"
Copyright (C) 2016 The R Foundation for Statistical Computing
Platform: x86_64-pc-linux-gnu (64-bit)

R is free software and comes with ABSOLUTELY NO WARRANTY.
You are welcome to redistribute it under certain conditions.
Type 'license()' or 'licence()' for distribution details.

R is a collaborative project with many contributors.
Type 'contributors()' for more information and
'citation()' on how to cite R or R packages in publications.

Type 'demo()' for some demos, 'help()' for on-line help, or
'help.start()' for an HTML browser interface to help.
Type 'q()' to quit R.

> library(geneRxCluster)
Loading required package: GenomicRanges
Loading required package: BiocGenerics
Loading required package: parallel

Attaching package: 'BiocGenerics'

The following objects are masked from 'package:parallel':

    clusterApply, clusterApplyLB, clusterCall, clusterEvalQ,
    clusterExport, clusterMap, parApply, parCapply, parLapply,
    parLapplyLB, parRapply, parSapply, parSapplyLB

The following objects are masked from 'package:stats':

    IQR, mad, xtabs

The following objects are masked from 'package:base':

    Filter, Find, Map, Position, Reduce, anyDuplicated, append,
    as.data.frame, cbind, colnames, do.call, duplicated, eval, evalq,
    get, grep, grepl, intersect, is.unsorted, lapply, lengths, mapply,
    match, mget, order, paste, pmax, pmax.int, pmin, pmin.int, rank,
    rbind, rownames, sapply, setdiff, sort, table, tapply, union,
    unique, unsplit

Loading required package: S4Vectors
Loading required package: stats4

Attaching package: 'S4Vectors'

The following objects are masked from 'package:base':

    colMeans, colSums, expand.grid, rowMeans, rowSums

Loading required package: IRanges
Loading required package: GenomeInfoDb
> png(filename="/home/ddbj/snapshot/RGM3/R_BC/result/geneRxCluster/gRxPlot.Rd_%03d_medium.png", width=480, height=480)
> ### Name: gRxPlot
> ### Title: gRxPlot
> ### Aliases: gRxPlot
>
> ### ** Examples
>
> x.seqnames <- rep(letters[1:3],each=500)
> x.starts <- c(seq(1,length=500),seq(1,by=2,length=500),seq(1,by=3,length=500))
> x.lens <- rep(c(5,10,15,20,25),each=20)
> x.group <- rep(rep(c(TRUE,FALSE),length=length(x.lens)),x.lens)
> ## add a bit of fuzz:
> x.group <- 1==rbinom(length(x.group),1,pr=ifelse(x.group,.8,.2))
> x.kvals <- as.integer(sort(unique(x.lens)))
> x.res <- gRxCluster(x.seqnames,x.starts,x.group,x.kvals)
> gRxPlot(x.res)
> rm( x.seqnames, x.starts, x.lens, x.group, x.kvals, x.res)
>
>
>
>
>
> dev.off()
null device
          1
>
|
Created & Maintained by Osamu Ogasawara (osamu.ogasawara@gmail.com) and 