Supported by Dr. Osamu Ogasawara and  . . |
|
Last data update: 2014.03.03 |
Class "rowROC"DescriptionA class to model ROC curves and corresponding area under the curve as produced by rowpAUCs. Objects from the ClassObjects can be created by calls of the form Slots
Methods
Author(s)Florian Hahne <fhahne@fhcrc.org> ReferencesPepe MS, Longton G, Anderson GL, Schummer M.: Selecting differentially expressed genes from microarray experiments. Biometrics. 2003 Mar;59(1):133-42. See Also
Examples
library(Biobase)
require(genefilter)
data(sample.ExpressionSet)
roc <- rowpAUCs(sample.ExpressionSet, "sex", p=0.5)
roc
area(roc[1:3])

if(interactive()) {
par(ask=TRUE)
plot(roc)
plot(1-spec(roc[1]), sens(roc[2]))
par(ask=FALSE)
}

pAUC(roc, 0.1)
roc
Results
R version 3.3.1 (2016-06-21) -- "Bug in Your Hair"
Copyright (C) 2016 The R Foundation for Statistical Computing
Platform: x86_64-pc-linux-gnu (64-bit)
R is free software and comes with ABSOLUTELY NO WARRANTY.
You are welcome to redistribute it under certain conditions.
Type 'license()' or 'licence()' for distribution details.
R is a collaborative project with many contributors.
Type 'contributors()' for more information and
'citation()' on how to cite R or R packages in publications.
Type 'demo()' for some demos, 'help()' for on-line help, or
'help.start()' for an HTML browser interface to help.
Type 'q()' to quit R.
> library(genefilter)
> png(filename="/home/ddbj/snapshot/RGM3/R_BC/result/genefilter/rowROC-class.Rd_%03d_medium.png", width=480, height=480)
> ### Name: rowROC-class
> ### Title: Class "rowROC"
> ### Aliases: rowROC rowROC-class pAUC AUC sens spec area
> ### pAUC,rowROC,numeric-method plot,rowROC,missing-method
> ### AUC,rowROC-method spec,rowROC-method sens,rowROC-method
> ### area,rowROC-method show,rowROC-method [,rowROC-method
> ### Keywords: classes
>
> ### ** Examples
>
> library(Biobase)
Loading required package: BiocGenerics
Loading required package: parallel
Attaching package: 'BiocGenerics'
The following objects are masked from 'package:parallel':
clusterApply, clusterApplyLB, clusterCall, clusterEvalQ,
clusterExport, clusterMap, parApply, parCapply, parLapply,
parLapplyLB, parRapply, parSapply, parSapplyLB
The following objects are masked from 'package:stats':
IQR, mad, xtabs
The following objects are masked from 'package:base':
Filter, Find, Map, Position, Reduce, anyDuplicated, append,
as.data.frame, cbind, colnames, do.call, duplicated, eval, evalq,
get, grep, grepl, intersect, is.unsorted, lapply, lengths, mapply,
match, mget, order, paste, pmax, pmax.int, pmin, pmin.int, rank,
rbind, rownames, sapply, setdiff, sort, table, tapply, union,
unique, unsplit
Welcome to Bioconductor
Vignettes contain introductory material; view with
'browseVignettes()'. To cite Bioconductor, see
'citation("Biobase")', and for packages 'citation("pkgname")'.
> require(genefilter)
> data(sample.ExpressionSet)
> roc <- rowpAUCs(sample.ExpressionSet, "sex", p=0.5)
> roc
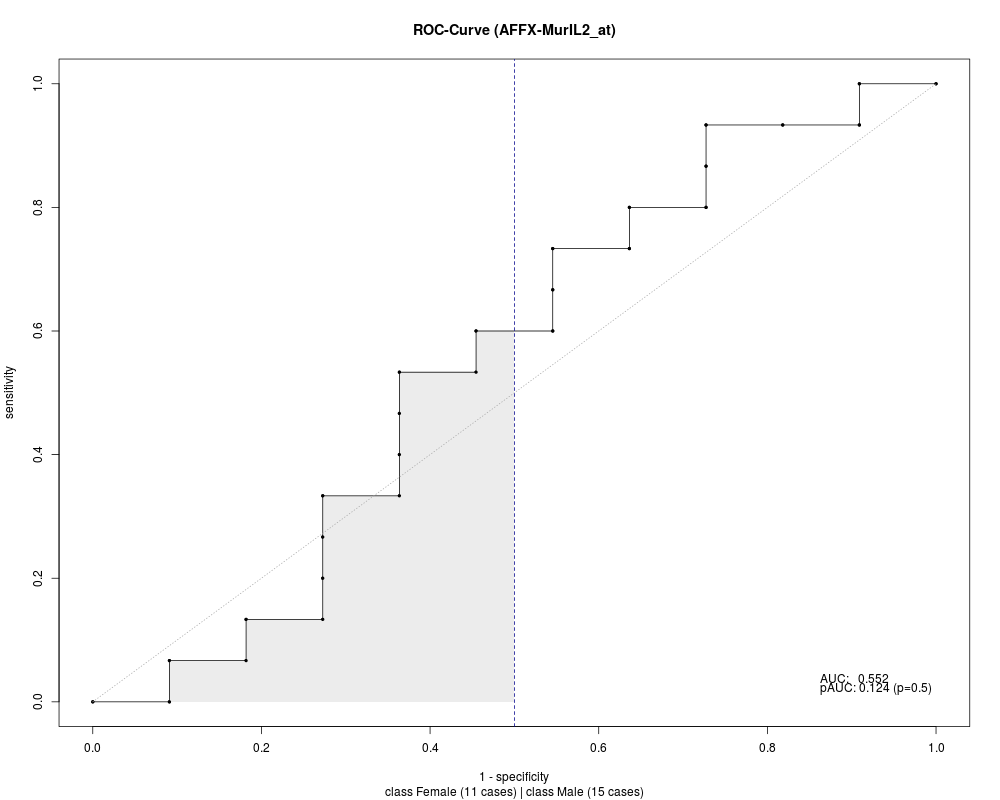
matrix of ROC curves for 500 genes/rows with 27 cutpoints
size of class Female: 11
size of class Male: 15
partial areas under curve calculated for p=0.5
> area(roc[1:3])
AFFX-MurIL2_at AFFX-MurIL10_at AFFX-MurIL4_at
0.1242424 0.1030303 0.1575758
>
> #if(interactive()) {
> par(ask=TRUE)
> plot(roc)
> plot(1-spec(roc[1]), sens(roc[2]))
> par(ask=FALSE)
> #}
>
> pAUC(roc, 0.1)
matrix of ROC curves for 500 genes/rows with 27 cutpoints
size of class Female: 11
size of class Male: 15
partial areas under curve calculated for p=0.1
> roc
matrix of ROC curves for 500 genes/rows with 27 cutpoints
size of class Female: 11
size of class Male: 15
partial areas under curve calculated for p=0.5
>
>
>
>
>
> dev.off()
null device
1
>
|