Supported by Dr. Osamu Ogasawara and  . . |
|
Last data update: 2014.03.03 |
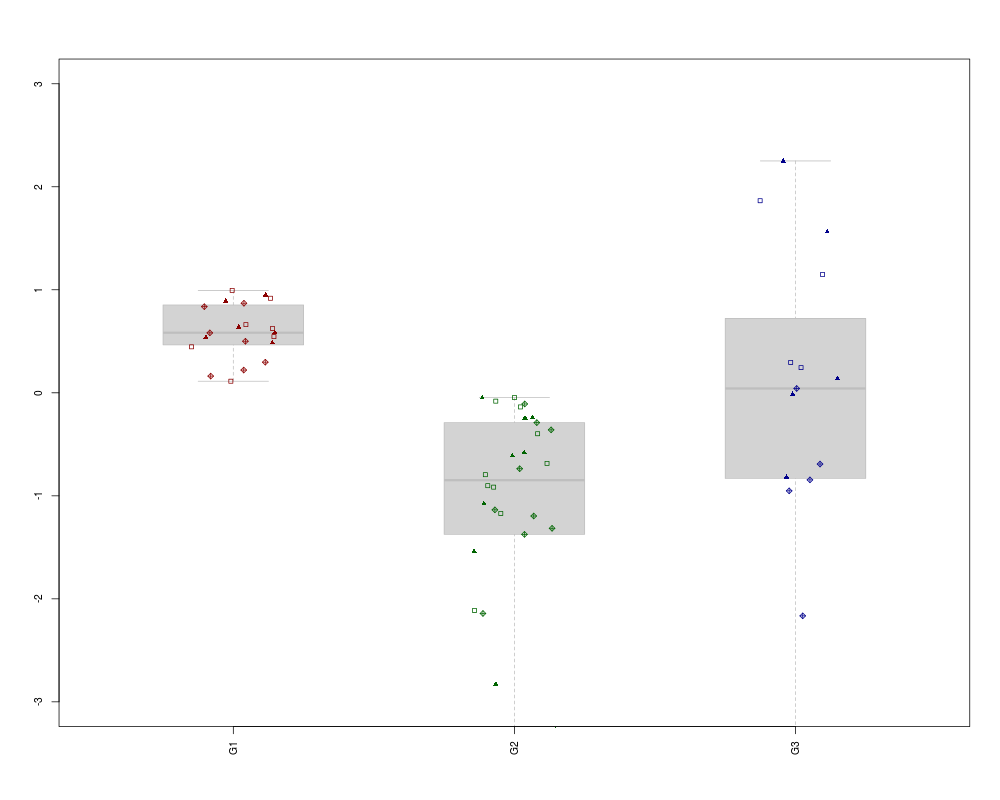
Box plot of group of values with corresponding jittered pointsDescriptionThis function allows for display a boxplot with jittered points. Usageboxplotplus2(x, .jit = 0.25, .las = 1, .ylim, box.col = "lightgrey", pt.col = "blue", pt.cex = 0.5, pt.pch = 16, med.line = FALSE, med.col = "goldenrod", ...) Arguments
ValueNumber of samples in each group. Note2.21.2006 - Christos Hatzis, Nuvera Biosciences Author(s)Christos Hatzis See Also
Examples
dd <- list("G1"=runif(20), "G2"=rexp(30) * -1.1, "G3"=rnorm(15) * 1.3)
boxplotplus2(x=dd, .las=3, .jit=0.75, .ylim=c(-3,3), pt.cex=0.75,
  pt.col=c(rep("darkred", 20), rep("darkgreen", 30), rep("darkblue", 15)),
  pt.pch=c(0, 9, 17))
Results
R version 3.3.1 (2016-06-21) -- "Bug in Your Hair"
Copyright (C) 2016 The R Foundation for Statistical Computing
Platform: x86_64-pc-linux-gnu (64-bit)

R is free software and comes with ABSOLUTELY NO WARRANTY.
You are welcome to redistribute it under certain conditions.
Type 'license()' or 'licence()' for distribution details.

R is a collaborative project with many contributors.
Type 'contributors()' for more information and
'citation()' on how to cite R or R packages in publications.

Type 'demo()' for some demos, 'help()' for on-line help, or
'help.start()' for an HTML browser interface to help.
Type 'q()' to quit R.

> library(genefu)
Loading required package: survcomp
Loading required package: survival
Loading required package: prodlim
Loading required package: mclust
Package 'mclust' version 5.2
Type 'citation("mclust")' for citing this R package in publications.
Loading required package: limma
Loading required package: biomaRt
Loading required package: iC10
Loading required package: pamr
Loading required package: cluster
Loading required package: iC10TrainingData
Loading required package: AIMS
Loading required package: e1071
Loading required package: Biobase
Loading required package: BiocGenerics
Loading required package: parallel

Attaching package: 'BiocGenerics'

The following objects are masked from 'package:parallel':

    clusterApply, clusterApplyLB, clusterCall, clusterEvalQ,
    clusterExport, clusterMap, parApply, parCapply, parLapply,
    parLapplyLB, parRapply, parSapply, parSapplyLB

The following object is masked from 'package:limma':

    plotMA

The following objects are masked from 'package:stats':

    IQR, mad, xtabs

The following objects are masked from 'package:base':

    Filter, Find, Map, Position, Reduce, anyDuplicated, append,
    as.data.frame, cbind, colnames, do.call, duplicated, eval, evalq,
    get, grep, grepl, intersect, is.unsorted, lapply, lengths, mapply,
    match, mget, order, paste, pmax, pmax.int, pmin, pmin.int, rank,
    rbind, rownames, sapply, setdiff, sort, table, tapply, union,
    unique, unsplit

Welcome to Bioconductor

    Vignettes contain introductory material; view with
    'browseVignettes()'. To cite Bioconductor, see
    'citation("Biobase")', and for packages 'citation("pkgname")'.

> png(filename="/home/ddbj/snapshot/RGM3/R_BC/result/genefu/boxplotplus2.Rd_%03d_medium.png", width=480, height=480)
> ### Name: boxplotplus2
> ### Title: Box plot of group of values with corresponding jittered points
> ### Aliases: boxplotplus2
>
> ### ** Examples
>
> dd <- list("G1"=runif(20), "G2"=rexp(30) * -1.1, "G3"=rnorm(15) * 1.3)
> boxplotplus2(x=dd, .las=3, .jit=0.75, .ylim=c(-3,3), pt.cex=0.75,
+   pt.col=c(rep("darkred", 20), rep("darkgreen", 30), rep("darkblue", 15)),
+   pt.pch=c(0, 9, 17))
G1 G2 G3
20 30 15
>
>
>
>
>
> dev.off()
null device
          1
>
|