Supported by Dr. Osamu Ogasawara and  . . |
|
Last data update: 2014.03.03 |
Function to identify breast cancer molecular subtypes using the Subtype Clustering ModelDescriptionThis function identifies the breast cancer molecular subtypes using a Subtype Clustering Model fitted by Usagesubtype.cluster.predict(sbt.model, data, annot, do.mapping = FALSE, mapping, do.prediction.strength = FALSE, do.BIC = FALSE, plot = FALSE, verbose = FALSE) Arguments
Value
Author(s)Benjamin Haibe-Kains ReferencesDesmedt C, Haibe-Kains B, Wirapati P, Buyse M, Larsimont D, Bontempi G, Delorenzi M, Piccart M, and Sotiriou C (2008) "Biological processes associated with breast cancer clinical outcome depend on the molecular subtypes", Clinical Cancer Research, 14(16):5158–5165. Wirapati P, Sotiriou C, Kunkel S, Farmer P, Pradervand S, Haibe-Kains B, Desmedt C, Ignatiadis M, Sengstag T, Schutz F, Goldstein DR, Piccart MJ and Delorenzi M (2008) "Meta-analysis of Gene-Expression Profiles in Breast Cancer: Toward a Unified Understanding of Breast Cancer Sub-typing and Prognosis Signatures", Breast Cancer Research, 10(4):R65. Tibshirani R and Walther G (2005) "Cluster Validation by Prediction Strength", Journal of Computational and Graphical Statistics, 14(3):511–528 See Also
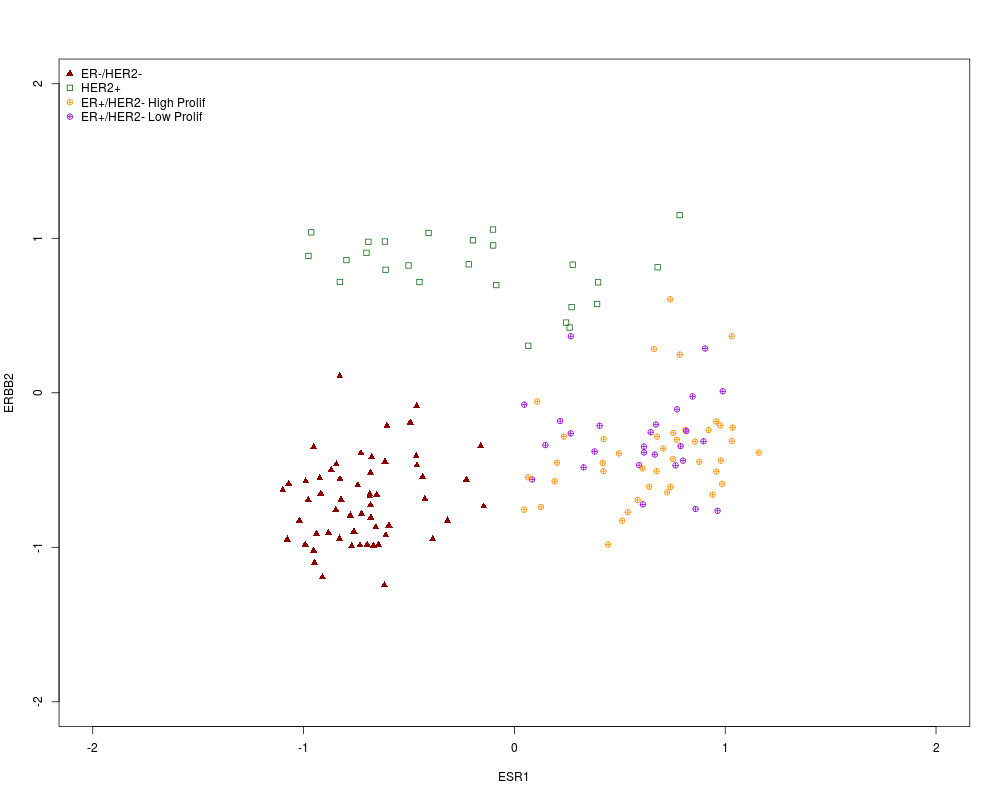
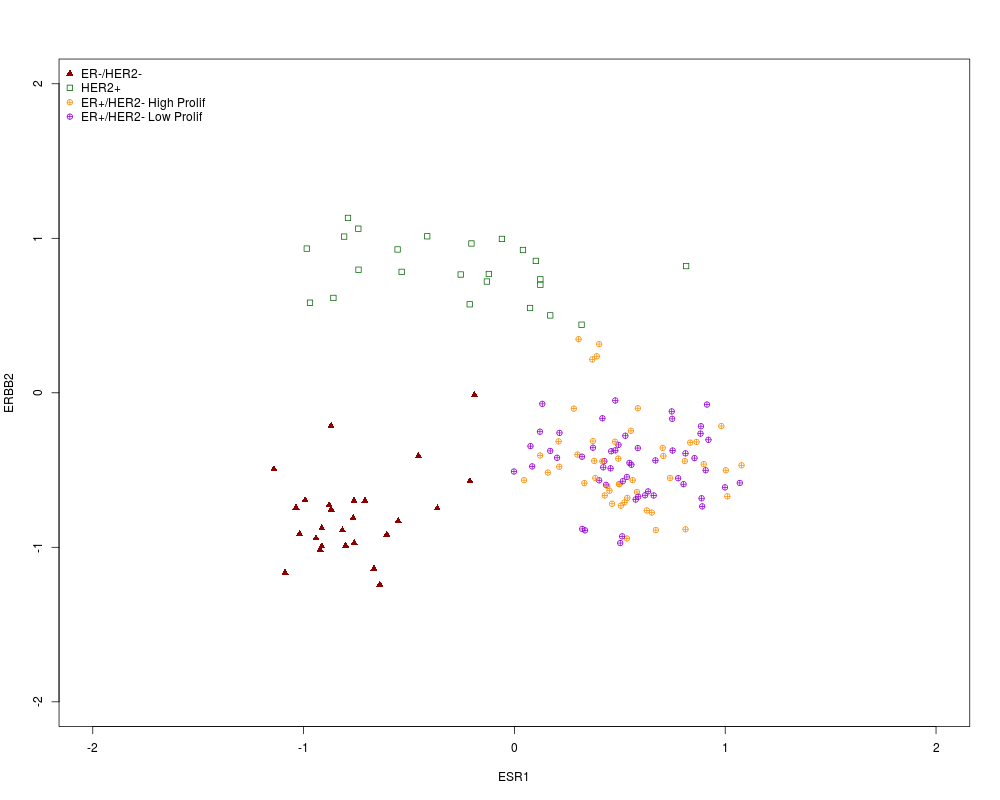
Examples## without mapping (affy hgu133a or plus2 only) ## load VDX data data(vdxs) ## Subtype Clustering Model fitted on EXPO and applied on VDX sbt.vdxs <- subtype.cluster.predict(sbt.model=scmgene.robust, data=data.vdxs, annot=annot.vdxs, do.mapping=FALSE, do.prediction.strength=FALSE, do.BIC=FALSE, plot=TRUE, verbose=TRUE) table(sbt.vdxs$subtype) table(sbt.vdxs$subtype2) ## with mapping ## load NKI data data(nkis) ## Subtype Clustering Model fitted on EXPO and applied on NKI sbt.nkis <- subtype.cluster.predict(sbt.model=scmgene.robust, data=data.nkis, annot=annot.nkis, do.mapping=TRUE, do.prediction.strength=FALSE, do.BIC=FALSE, plot=TRUE, verbose=TRUE) table(sbt.nkis$subtype) table(sbt.nkis$subtype2) Results
R version 3.3.1 (2016-06-21) -- "Bug in Your Hair"
Copyright (C) 2016 The R Foundation for Statistical Computing
Platform: x86_64-pc-linux-gnu (64-bit)

R is free software and comes with ABSOLUTELY NO WARRANTY.
You are welcome to redistribute it under certain conditions.
Type 'license()' or 'licence()' for distribution details.

R is a collaborative project with many contributors.
Type 'contributors()' for more information and
'citation()' on how to cite R or R packages in publications.

Type 'demo()' for some demos, 'help()' for on-line help, or
'help.start()' for an HTML browser interface to help.
Type 'q()' to quit R.

> library(genefu)
Loading required package: survcomp
Loading required package: survival
Loading required package: prodlim
Loading required package: mclust
Package 'mclust' version 5.2
Type 'citation("mclust")' for citing this R package in publications.
Loading required package: limma
Loading required package: biomaRt
Loading required package: iC10
Loading required package: pamr
Loading required package: cluster
Loading required package: iC10TrainingData
Loading required package: AIMS
Loading required package: e1071
Loading required package: Biobase
Loading required package: BiocGenerics
Loading required package: parallel

Attaching package: 'BiocGenerics'

The following objects are masked from 'package:parallel':

    clusterApply, clusterApplyLB, clusterCall, clusterEvalQ,
    clusterExport, clusterMap, parApply, parCapply, parLapply,
    parLapplyLB, parRapply, parSapply, parSapplyLB

The following object is masked from 'package:limma':

    plotMA

The following objects are masked from 'package:stats':

    IQR, mad, xtabs

The following objects are masked from 'package:base':

    Filter, Find, Map, Position, Reduce, anyDuplicated, append,
    as.data.frame, cbind, colnames, do.call, duplicated, eval, evalq,
    get, grep, grepl, intersect, is.unsorted, lapply, lengths, mapply,
    match, mget, order, paste, pmax, pmax.int, pmin, pmin.int, rank,
    rbind, rownames, sapply, setdiff, sort, table, tapply, union,
    unique, unsplit

Welcome to Bioconductor

    Vignettes contain introductory material; view with
    'browseVignettes()'. To cite Bioconductor, see
    'citation("Biobase")', and for packages 'citation("pkgname")'.

> png(filename="/home/ddbj/snapshot/RGM3/R_BC/result/genefu/subtype.cluster.predict.Rd_%03d_medium.png", width=480, height=480)
> ### Name: subtype.cluster.predict
> ### Title: Function to identify breast cancer molecular subtypes using the
> ###   Subtype Clustering Model
> ### Aliases: subtype.cluster.predict
> ### Keywords: clustering
>
> ### ** Examples
>
> ## without mapping (affy hgu133a or plus2 only)
> ## load VDX data
> data(vdxs)
> ## Subtype Clustering Model fitted on EXPO and applied on VDX
> sbt.vdxs <- subtype.cluster.predict(sbt.model=scmgene.robust, data=data.vdxs,
+   annot=annot.vdxs, do.mapping=FALSE, do.prediction.strength=FALSE,
+   do.BIC=FALSE, plot=TRUE, verbose=TRUE)
> table(sbt.vdxs$subtype)

ER+/HER2- ER-/HER2-     HER2+
       69        56        25
> table(sbt.vdxs$subtype2)

ER+/HER2- High Prolif  ER+/HER2- Low Prolif             ER-/HER2-
                   42                    27                    56
                HER2+
                   25
>
> ## with mapping
> ## load NKI data
> data(nkis)
> ## Subtype Clustering Model fitted on EXPO and applied on NKI
> sbt.nkis <- subtype.cluster.predict(sbt.model=scmgene.robust, data=data.nkis,
+   annot=annot.nkis, do.mapping=TRUE, do.prediction.strength=FALSE,
+   do.BIC=FALSE, plot=TRUE, verbose=TRUE)
> table(sbt.nkis$subtype)

ER+/HER2- ER-/HER2-     HER2+
       99        27        24
> table(sbt.nkis$subtype2)

ER+/HER2- High Prolif  ER+/HER2- Low Prolif             ER-/HER2-
                   47                    52                    27
                HER2+
                   24
>
>
>
>
>
> dev.off()
null device
          1
>
|