Supported by Dr. Osamu Ogasawara and  . . |
|
Last data update: 2014.03.03 |
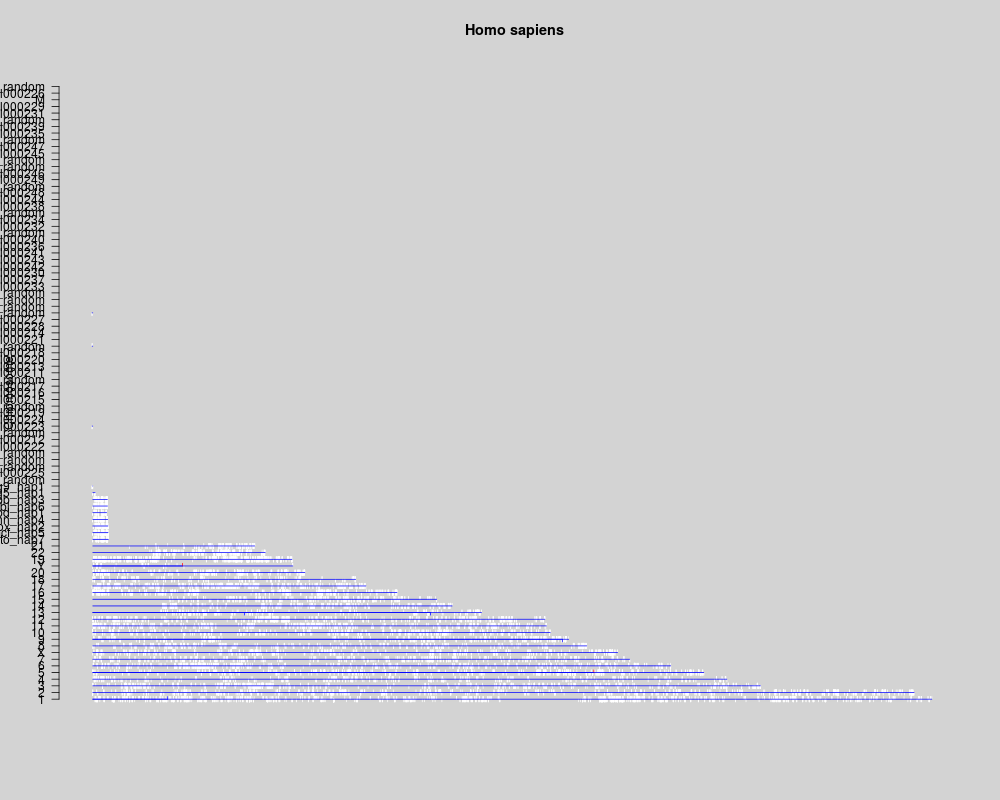
A function for marking specific probes on a cPlot.DescriptionGiven a set of probes, will highlight them in the color desired on a plot which has already been created via the function cPlot(). Usage
cColor(probes, color, plotChroms, scale=c("relative","max"), glen=0.4,
       ...)
Arguments
DetailsIt is important to call the function Author(s)Jeff Gentry See Also
Examples
  if (require("hgu95av2.db")) {
    z <- buildChromLocation("hgu95av2")
    cPlot(z)
    probes <- c("266_s_at", "31411_at", "610_at", "failExample")
    cColor(probes, "red", z)
    probes2 <- c("960_g_at", "41807_at", "931_at", "39032_at")
    cColor(probes2, "blue", z)
  } else
    print("Need hgu95av2.db data package for the example")
Results
R version 3.3.1 (2016-06-21) -- "Bug in Your Hair"
Copyright (C) 2016 The R Foundation for Statistical Computing
Platform: x86_64-pc-linux-gnu (64-bit)

R is free software and comes with ABSOLUTELY NO WARRANTY.
You are welcome to redistribute it under certain conditions.
Type 'license()' or 'licence()' for distribution details.

R is a collaborative project with many contributors.
Type 'contributors()' for more information and
'citation()' on how to cite R or R packages in publications.

Type 'demo()' for some demos, 'help()' for on-line help, or
'help.start()' for an HTML browser interface to help.
Type 'q()' to quit R.

> library(geneplotter)
Loading required package: Biobase
Loading required package: BiocGenerics
Loading required package: parallel

Attaching package: 'BiocGenerics'

The following objects are masked from 'package:parallel':

    clusterApply, clusterApplyLB, clusterCall, clusterEvalQ,
    clusterExport, clusterMap, parApply, parCapply, parLapply,
    parLapplyLB, parRapply, parSapply, parSapplyLB

The following objects are masked from 'package:stats':

    IQR, mad, xtabs

The following objects are masked from 'package:base':

    Filter, Find, Map, Position, Reduce, anyDuplicated, append,
    as.data.frame, cbind, colnames, do.call, duplicated, eval, evalq,
    get, grep, grepl, intersect, is.unsorted, lapply, lengths, mapply,
    match, mget, order, paste, pmax, pmax.int, pmin, pmin.int, rank,
    rbind, rownames, sapply, setdiff, sort, table, tapply, union,
    unique, unsplit

Welcome to Bioconductor

    Vignettes contain introductory material; view with
    'browseVignettes()'. To cite Bioconductor, see
    'citation("Biobase")', and for packages 'citation("pkgname")'.

Loading required package: lattice
Loading required package: annotate
Loading required package: AnnotationDbi
Loading required package: stats4
Loading required package: IRanges
Loading required package: S4Vectors

Attaching package: 'S4Vectors'

The following objects are masked from 'package:base':

    colMeans, colSums, expand.grid, rowMeans, rowSums

Loading required package: XML
> png(filename="/home/ddbj/snapshot/RGM3/R_BC/result/geneplotter/cColor.Rd_%03d_medium.png", width=480, height=480)
> ### Name: cColor
> ### Title: A function for marking specific probes on a cPlot.
> ### Aliases: cColor
> ### Keywords: utilities
>
> ### ** Examples
>
>   if (require("hgu95av2.db")) {
+     z <- buildChromLocation("hgu95av2")
+     cPlot(z)
+     probes <- c("266_s_at", "31411_at", "610_at", "failExample")
+     cColor(probes, "red", z)
+     probes2 <- c("960_g_at", "41807_at", "931_at", "39032_at")
+     cColor(probes2, "blue", z)
+   } else
+     print("Need hgu95av2.db data package for the example")
Loading required package: hgu95av2.db
Loading required package: org.Hs.eg.db


>
>
>
>
>
> dev.off()
null device
          1
>
|