Supported by Dr. Osamu Ogasawara and  . . |
|
Last data update: 2014.03.03 |
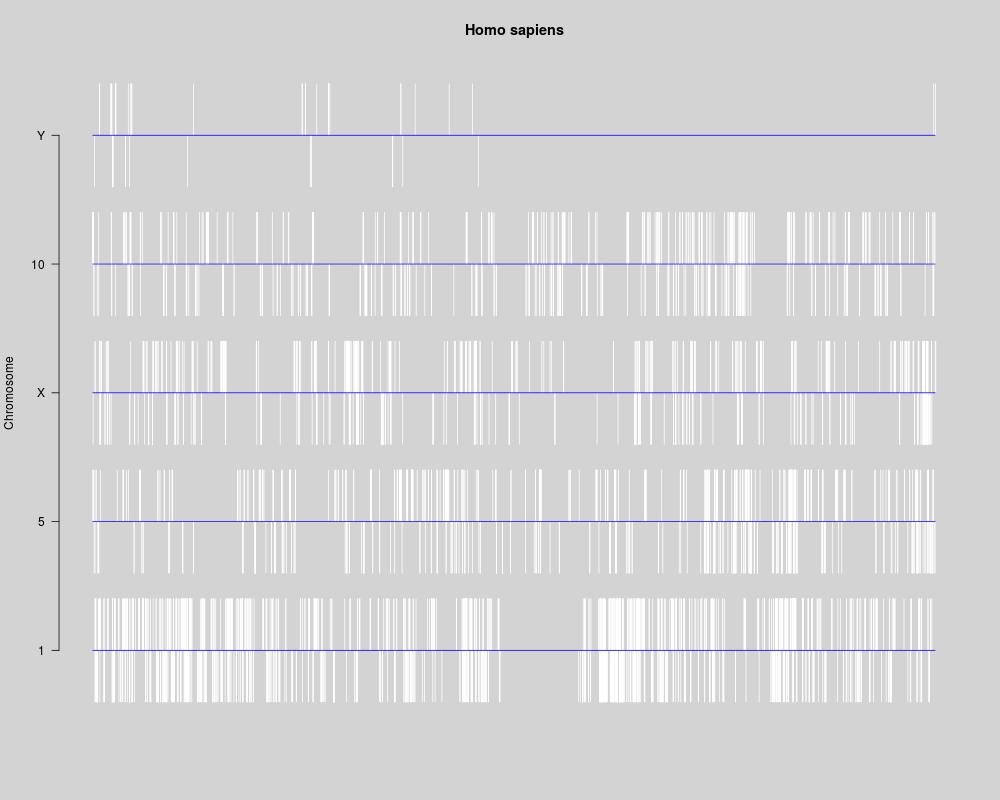
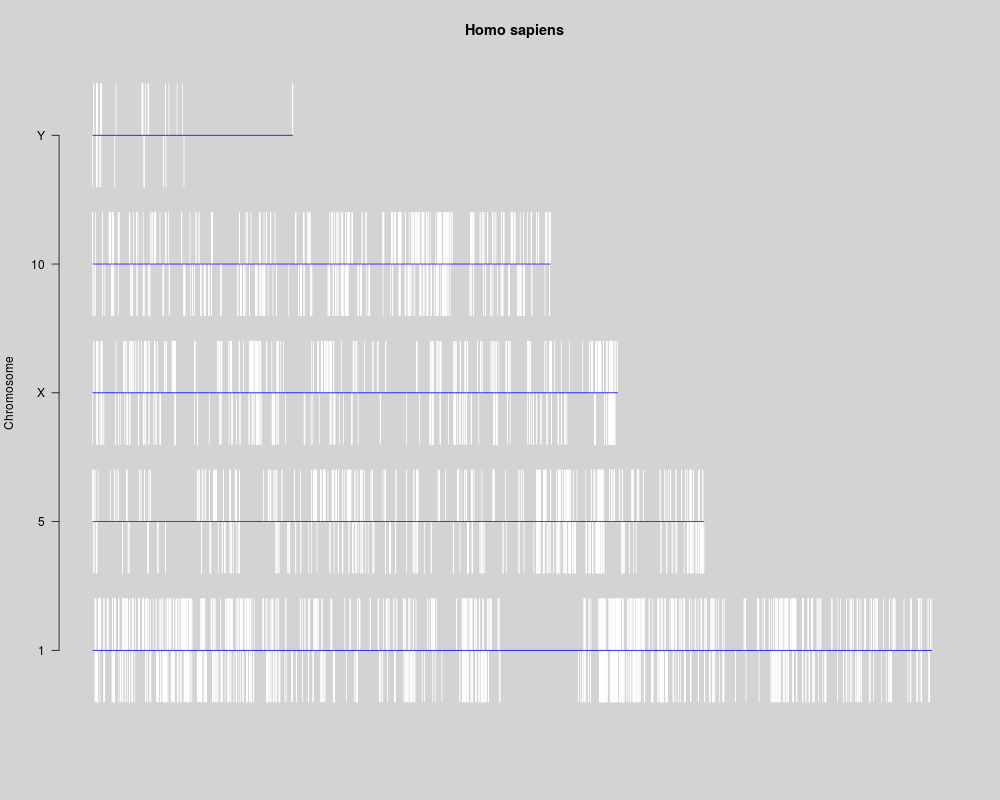
A plotting function for chromosomes.DescriptionGiven a chromLocation object, will plot all the gene locations from that object. Usage
cPlot(plotChroms, useChroms=chromNames(plotChroms),
      scale=c("relative","max"), fg="white", bg="lightgrey",
      glen=0.4, xlab="", ylab="Chromosome",
      main = organism(plotChroms), ...)
Arguments
DetailsThis function will first use the lengths of the chromosomes, stored in
the object to create scaling factors for the X axis. Once the
scaling factors are determined, the Author(s)Jeff Gentry See Also
Examples
   ## A bit of a hack to not have a package dependency on hgu95av2
   ## but need to fiddle w/ the warn level to not fail the example anyways.

   curWarn <- options(warn=0)
   on.exit(options(curWarn), add=TRUE)
   if (require("hgu95av2.db")) {
       z <- buildChromLocation("hgu95av2")

       if (interactive()) {
           curPar <- par(ask=TRUE)
           on.exit(par(curPar), add=TRUE)
       }

       for (sc in c("max","relative"))
           cPlot(z,c("1","5","10","X","Y"),sc)
   } else print("This example can not be run without hgu95av2 data package")
Results
R version 3.3.1 (2016-06-21) -- "Bug in Your Hair"
Copyright (C) 2016 The R Foundation for Statistical Computing
Platform: x86_64-pc-linux-gnu (64-bit)

R is free software and comes with ABSOLUTELY NO WARRANTY.
You are welcome to redistribute it under certain conditions.
Type 'license()' or 'licence()' for distribution details.

R is a collaborative project with many contributors.
Type 'contributors()' for more information and
'citation()' on how to cite R or R packages in publications.

Type 'demo()' for some demos, 'help()' for on-line help, or
'help.start()' for an HTML browser interface to help.
Type 'q()' to quit R.

> library(geneplotter)
Loading required package: Biobase
Loading required package: BiocGenerics
Loading required package: parallel

Attaching package: 'BiocGenerics'

The following objects are masked from 'package:parallel':

    clusterApply, clusterApplyLB, clusterCall, clusterEvalQ,
    clusterExport, clusterMap, parApply, parCapply, parLapply,
    parLapplyLB, parRapply, parSapply, parSapplyLB

The following objects are masked from 'package:stats':

    IQR, mad, xtabs

The following objects are masked from 'package:base':

    Filter, Find, Map, Position, Reduce, anyDuplicated, append,
    as.data.frame, cbind, colnames, do.call, duplicated, eval, evalq,
    get, grep, grepl, intersect, is.unsorted, lapply, lengths, mapply,
    match, mget, order, paste, pmax, pmax.int, pmin, pmin.int, rank,
    rbind, rownames, sapply, setdiff, sort, table, tapply, union,
    unique, unsplit

Welcome to Bioconductor

    Vignettes contain introductory material; view with
    'browseVignettes()'. To cite Bioconductor, see
    'citation("Biobase")', and for packages 'citation("pkgname")'.

Loading required package: lattice
Loading required package: annotate
Loading required package: AnnotationDbi
Loading required package: stats4
Loading required package: IRanges
Loading required package: S4Vectors

Attaching package: 'S4Vectors'

The following objects are masked from 'package:base':

    colMeans, colSums, expand.grid, rowMeans, rowSums

Loading required package: XML
> png(filename="/home/ddbj/snapshot/RGM3/R_BC/result/geneplotter/cPlot.Rd_%03d_medium.png", width=480, height=480)
> ### Name: cPlot
> ### Title: A plotting function for chromosomes.
> ### Aliases: cPlot
> ### Keywords: utilities
>
> ### ** Examples
>
>    ## A bit of a hack to not have a package dependency on hgu95av2
>    ## but need to fiddle w/ the warn level to not fail the example anyways.
>
>    curWarn <- options(warn=0)
>    on.exit(options(curWarn), add=TRUE)
>    if (require("hgu95av2.db")) {
+        z <- buildChromLocation("hgu95av2")
+
+ #       if (interactive()) {
+            curPar <- par(ask=TRUE)
+            on.exit(par(curPar), add=TRUE)
+ #       }
+
+        for (sc in c("max","relative"))
+            cPlot(z,c("1","5","10","X","Y"),sc)
+    } else print("This example can not be run without hgu95av2 data package")
Loading required package: hgu95av2.db
Loading required package: org.Hs.eg.db


>
>
>
>
>
> dev.off()
null device
          1
>
|