Supported by Dr. Osamu Ogasawara and  . . |
|
Last data update: 2014.03.03 |
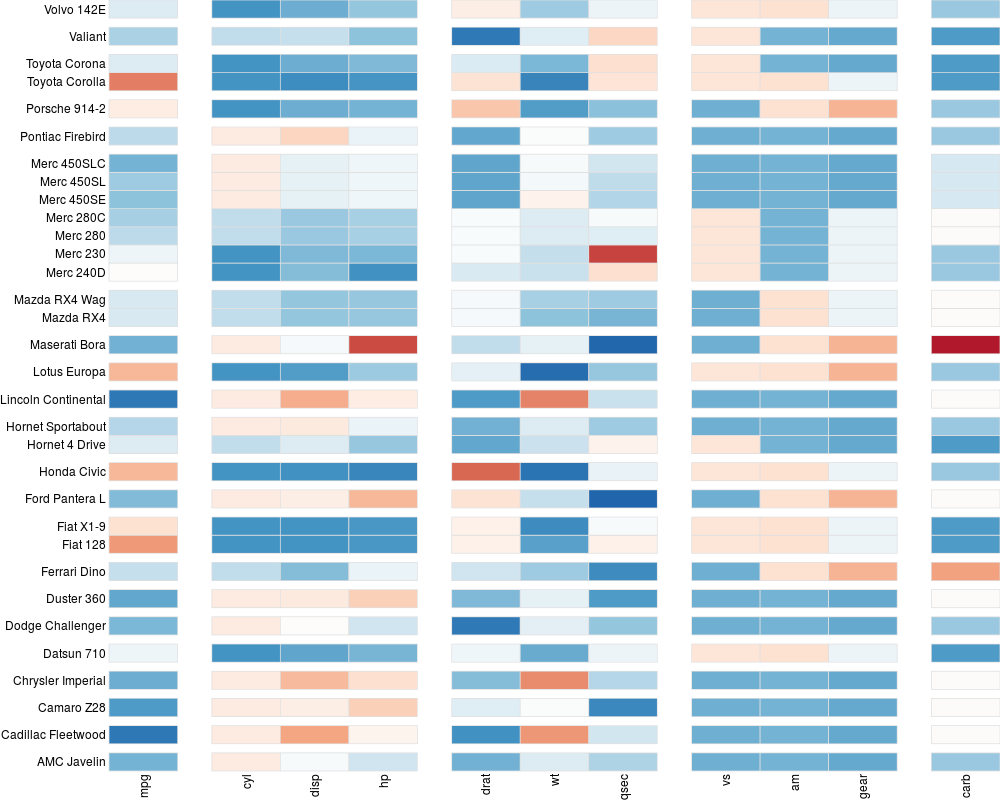
Heatmap of a matrix with grouped rows and columnsDescriptionThe function uses Usage
groupedHeatmap(z, frow, fcol,
  fillcolours = c("#2166ac","#4393c3","#92c5de","#d1e5f0","#fefefe","#fddbc7","#f4a582","#d6604d","#b2182b"),
  bordercolour = "#e0e0e0",
  zlim = range(z, na.rm=TRUE))
Arguments
DetailsThe function can be called within other drawing operations from the grid package, e.g. within a viewport. ValueThe function is called for its side effect, drawing text and rectangles on the current viewport. Author(s)Wolfgang Huber http://www.ebi.ac.uk/huber See Also
Examples
data("mtcars")

groupedHeatmap(
  scale(mtcars),
  frow = factor(sapply(strsplit(rownames(mtcars), " "), "[", 1)),
  fcol = factor(round(seq_len(ncol(mtcars))/3)))
Results
R version 3.3.1 (2016-06-21) -- "Bug in Your Hair"
Copyright (C) 2016 The R Foundation for Statistical Computing
Platform: x86_64-pc-linux-gnu (64-bit)

R is free software and comes with ABSOLUTELY NO WARRANTY.
You are welcome to redistribute it under certain conditions.
Type 'license()' or 'licence()' for distribution details.

R is a collaborative project with many contributors.
Type 'contributors()' for more information and
'citation()' on how to cite R or R packages in publications.

Type 'demo()' for some demos, 'help()' for on-line help, or
'help.start()' for an HTML browser interface to help.
Type 'q()' to quit R.

> library(geneplotter)
Loading required package: Biobase
Loading required package: BiocGenerics
Loading required package: parallel

Attaching package: 'BiocGenerics'

The following objects are masked from 'package:parallel':

    clusterApply, clusterApplyLB, clusterCall, clusterEvalQ,
    clusterExport, clusterMap, parApply, parCapply, parLapply,
    parLapplyLB, parRapply, parSapply, parSapplyLB

The following objects are masked from 'package:stats':

    IQR, mad, xtabs

The following objects are masked from 'package:base':

    Filter, Find, Map, Position, Reduce, anyDuplicated, append,
    as.data.frame, cbind, colnames, do.call, duplicated, eval, evalq,
    get, grep, grepl, intersect, is.unsorted, lapply, lengths, mapply,
    match, mget, order, paste, pmax, pmax.int, pmin, pmin.int, rank,
    rbind, rownames, sapply, setdiff, sort, table, tapply, union,
    unique, unsplit

Welcome to Bioconductor

    Vignettes contain introductory material; view with
    'browseVignettes()'. To cite Bioconductor, see
    'citation("Biobase")', and for packages 'citation("pkgname")'.

Loading required package: lattice
Loading required package: annotate
Loading required package: AnnotationDbi
Loading required package: stats4
Loading required package: IRanges
Loading required package: S4Vectors

Attaching package: 'S4Vectors'

The following objects are masked from 'package:base':

    colMeans, colSums, expand.grid, rowMeans, rowSums

Loading required package: XML
> png(filename="/home/ddbj/snapshot/RGM3/R_BC/result/geneplotter/groupedHeatmap.Rd_%03d_medium.png", width=480, height=480)
> ### Name: groupedHeatmap
> ### Title: Heatmap of a matrix with grouped rows and columns
> ### Aliases: groupedHeatmap
>
> ### ** Examples
>
>
> data("mtcars")
>
> groupedHeatmap(
+   scale(mtcars),
+   frow = factor(sapply(strsplit(rownames(mtcars), " "), "[", 1)),
+   fcol = factor(round(seq_len(ncol(mtcars))/3)))
>
>
>
>
>
> dev.off()
null device
          1
>
|