Supported by Dr. Osamu Ogasawara and  . . |
|
Last data update: 2014.03.03 |
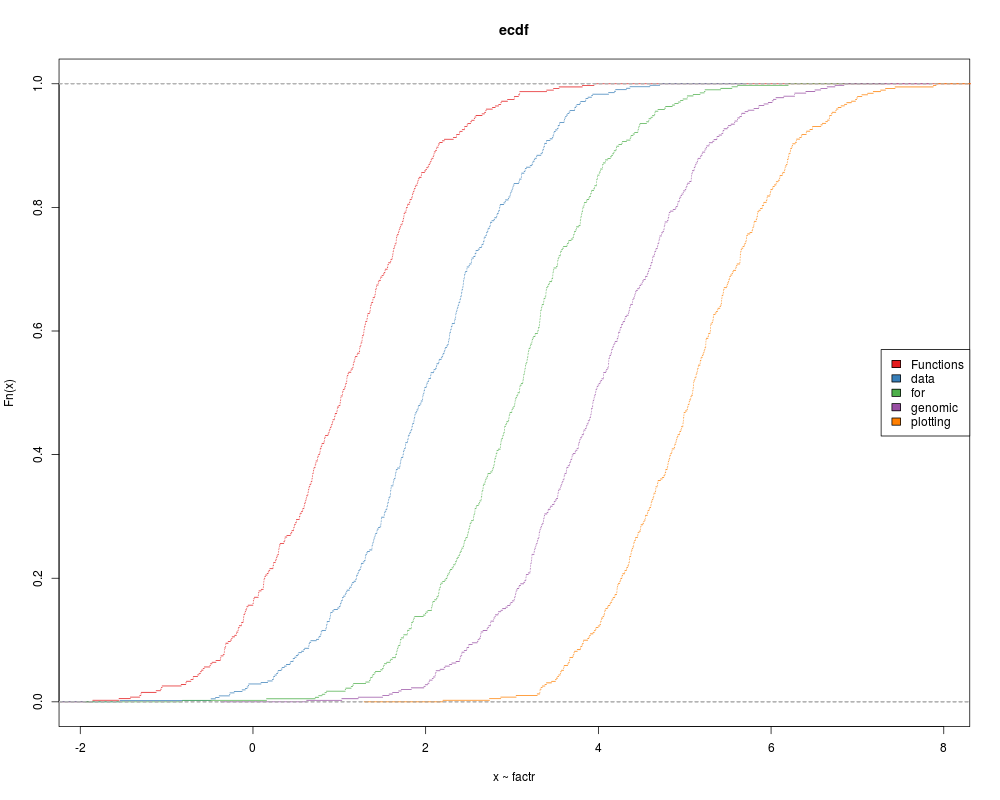
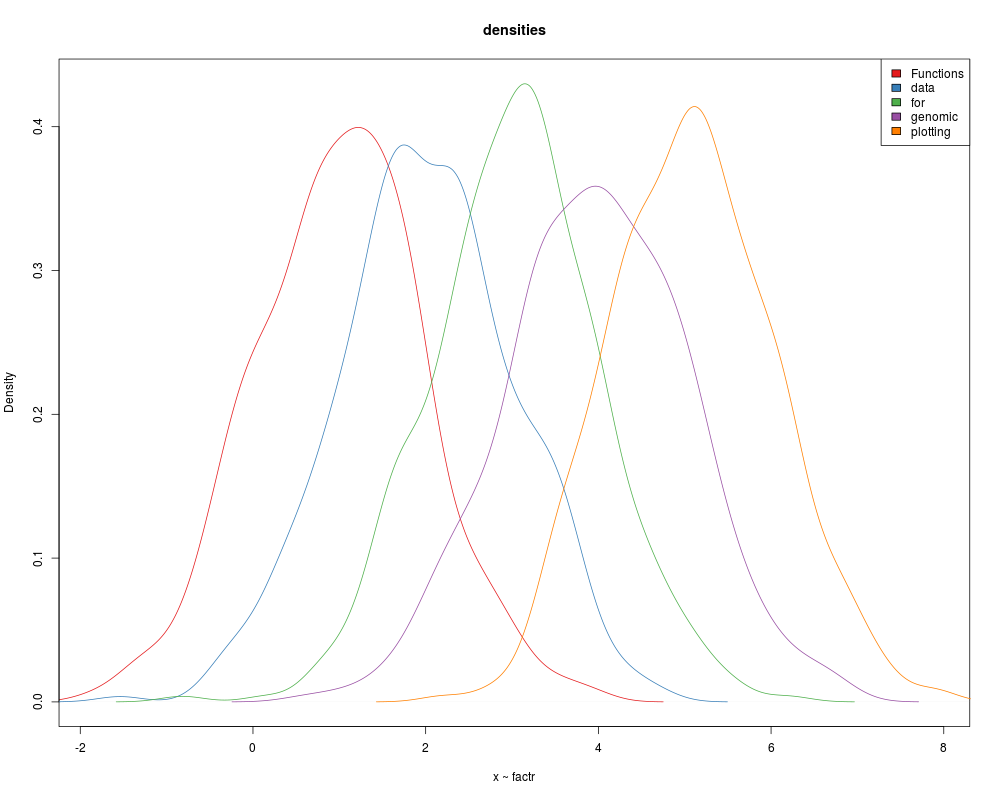
Multiple empirical cumulative distribution functions (ecdf) and densitiesDescriptionPlot multiple empirical cumulative distribution functions (ecdf)
and densities with a user interface similar to that of Usage
multiecdf(x, ...)
## S3 method for class 'formula'
multiecdf(formula, data = NULL, xlab, na.action = NULL, ...)
## S3 method for class 'matrix'
multiecdf(x, xlab, ...)
## S3 method for class 'list'
multiecdf(x,
          xlim,
          col = brewer.pal(9, "Set1"),
          main = "ecdf",
          xlab,
          do.points = FALSE,
          subsample = 1000L,
          legend = list(
            x = "right",
            legend = if(is.null(names(x))) paste(seq(along=x)) else names(x),
            fill = col),
          ...)

multidensity(x, ...)
## S3 method for class 'formula'
multidensity(formula, data = NULL, xlab, na.action = NULL, ...)
## S3 method for class 'matrix'
multidensity(x, xlab, ...)
## S3 method for class 'list'
multidensity(x,
             bw = "nrd0",
             xlim,
             ylim,
             col  = brewer.pal(9, "Set1"),
             main = if(length(x)==1) "density" else "densities",
             xlab,
             lty  = 1L,
             legend = list(
               x = "topright",
               legend = if(is.null(names(x))) paste(seq(along=x)) else names(x),
               fill = col),
             density = NULL,
             ...)
Arguments
DetailsDensity estimates: Bandwidths: the choice of the smoothing bandwidths in ValueFor the Author(s)Wolfgang Huber See Also
Examples
  words = strsplit(packageDescription("geneplotter")$Description, " ")[[1]]
  factr = factor(sample(words, 2000, replace = TRUE))
  x = rnorm(length(factr), mean=as.integer(factr))

  multiecdf(x ~ factr)
  multidensity(x ~ factr)
Results
R version 3.3.1 (2016-06-21) -- "Bug in Your Hair"
Copyright (C) 2016 The R Foundation for Statistical Computing
Platform: x86_64-pc-linux-gnu (64-bit)

R is free software and comes with ABSOLUTELY NO WARRANTY.
You are welcome to redistribute it under certain conditions.
Type 'license()' or 'licence()' for distribution details.

R is a collaborative project with many contributors.
Type 'contributors()' for more information and
'citation()' on how to cite R or R packages in publications.

Type 'demo()' for some demos, 'help()' for on-line help, or
'help.start()' for an HTML browser interface to help.
Type 'q()' to quit R.

> library(geneplotter)
Loading required package: Biobase
Loading required package: BiocGenerics
Loading required package: parallel

Attaching package: 'BiocGenerics'

The following objects are masked from 'package:parallel':

    clusterApply, clusterApplyLB, clusterCall, clusterEvalQ,
    clusterExport, clusterMap, parApply, parCapply, parLapply,
    parLapplyLB, parRapply, parSapply, parSapplyLB

The following objects are masked from 'package:stats':

    IQR, mad, xtabs

The following objects are masked from 'package:base':

    Filter, Find, Map, Position, Reduce, anyDuplicated, append,
    as.data.frame, cbind, colnames, do.call, duplicated, eval, evalq,
    get, grep, grepl, intersect, is.unsorted, lapply, lengths, mapply,
    match, mget, order, paste, pmax, pmax.int, pmin, pmin.int, rank,
    rbind, rownames, sapply, setdiff, sort, table, tapply, union,
    unique, unsplit

Welcome to Bioconductor

    Vignettes contain introductory material; view with
    'browseVignettes()'. To cite Bioconductor, see
    'citation("Biobase")', and for packages 'citation("pkgname")'.

Loading required package: lattice
Loading required package: annotate
Loading required package: AnnotationDbi
Loading required package: stats4
Loading required package: IRanges
Loading required package: S4Vectors

Attaching package: 'S4Vectors'

The following objects are masked from 'package:base':

    colMeans, colSums, expand.grid, rowMeans, rowSums

Loading required package: XML
> png(filename="/home/ddbj/snapshot/RGM3/R_BC/result/geneplotter/multiecdf.Rd_%03d_medium.png", width=480, height=480)
> ### Name: multiecdf
> ### Title: Multiple empirical cumulative distribution functions (ecdf) and
> ###   densities
> ### Aliases: multiecdf multiecdf.list multiecdf.formula multiecdf.matrix
> ###   multidensity multidensity.list multidensity.formula
> ###   multidensity.matrix
> ### Keywords: hplot
>
> ### ** Examples
>
>   words = strsplit(packageDescription("geneplotter")$Description, " ")[[1]]
>   factr = factor(sample(words, 2000, replace = TRUE))
>   x = rnorm(length(factr), mean=as.integer(factr))
>
>   multiecdf(x ~ factr)
>   multidensity(x ~ factr)
>
>
>
>
>
> dev.off()
null device
          1
>
|