The desired chromosome, e.g. for humans it would be a character string in the set of c(1:22, "X", "Y").
senseObj
The result of Makesense.
cols
A vector of colors for the lines in the plot, typically specified according to a certain pheotype of samples.
log
Logical, whether log-transformation should be taken on the smoothed expressions.
xloc
Determines whether the "Representative Genes"
will be displayed according to their relative
positions on the chromosome (physical), or spaced
evenly (equispaced). Default is equispaced.
geneSymbols
Logical, whether to use Affy IDs or
Gene Symbols for "Representative Genes", default is
Affy IDs.
ngenes
Desired number of "Representative Genes". The
number of actual displayed genes may differ.
lines.at
A vector of Affy IDs. Vertical lines will
be drawn at specified genes.
lines.col
A vector of colors associated with
lines.at.
Author(s)
Robert Gentleman and Xiaochun Li
See Also
Makesense
Examples
example(Makesense)

if (interactive())
  op <- par(ask=TRUE)

cols <- ifelse(expressionSet133a$cov1=="test 1", "red", "green")
plotChr("21", esetobj, cols)

# plot on log-scale:

plotChr("21", esetobj, cols, log=TRUE)

# genesymbol instead of probe names:

plotChr("21", esetobj, cols, log=TRUE, geneSymbols=TRUE)

# add vertical lines at genes of interest:

gs <- c("220372_at", "35776_at", "200943_at")
plotChr("21", esetobj, cols, log=TRUE, geneSymbols=FALSE, lines.at=gs)

# add vertical lines at genes of interest
# with specified colors:

gs <- c("220372_at", "35776_at", "200943_at")
cc <- c("blue", "cyan","magenta")
plotChr("21", esetobj, cols, log=TRUE, geneSymbols=FALSE, lines.at=gs,
lines.col=cc)
if (interactive())
  par(op)
Results
R version 3.3.1 (2016-06-21) -- "Bug in Your Hair"
Copyright (C) 2016 The R Foundation for Statistical Computing
Platform: x86_64-pc-linux-gnu (64-bit)
R is free software and comes with ABSOLUTELY NO WARRANTY.
You are welcome to redistribute it under certain conditions.
Type 'license()' or 'licence()' for distribution details.
R is a collaborative project with many contributors.
Type 'contributors()' for more information and
'citation()' on how to cite R or R packages in publications.
Type 'demo()' for some demos, 'help()' for on-line help, or
'help.start()' for an HTML browser interface to help.
Type 'q()' to quit R.
> library(geneplotter)
Loading required package: Biobase
Loading required package: BiocGenerics
Loading required package: parallel
Attaching package: 'BiocGenerics'
The following objects are masked from 'package:parallel':
clusterApply, clusterApplyLB, clusterCall, clusterEvalQ,
clusterExport, clusterMap, parApply, parCapply, parLapply,
parLapplyLB, parRapply, parSapply, parSapplyLB
The following objects are masked from 'package:stats':
IQR, mad, xtabs
The following objects are masked from 'package:base':
Filter, Find, Map, Position, Reduce, anyDuplicated, append,
as.data.frame, cbind, colnames, do.call, duplicated, eval, evalq,
get, grep, grepl, intersect, is.unsorted, lapply, lengths, mapply,
match, mget, order, paste, pmax, pmax.int, pmin, pmin.int, rank,
rbind, rownames, sapply, setdiff, sort, table, tapply, union,
unique, unsplit
Welcome to Bioconductor
Vignettes contain introductory material; view with
'browseVignettes()'. To cite Bioconductor, see
'citation("Biobase")', and for packages 'citation("pkgname")'.
Loading required package: lattice
Loading required package: annotate
Loading required package: AnnotationDbi
Loading required package: stats4
Loading required package: IRanges
Loading required package: S4Vectors
Attaching package: 'S4Vectors'
The following objects are masked from 'package:base':
colMeans, colSums, expand.grid, rowMeans, rowSums
Loading required package: XML
> png(filename="/home/ddbj/snapshot/RGM3/R_BC/result/geneplotter/plotChr.Rd_%03d_medium.png", width=480, height=480)
> ### Name: plotChr
> ### Title: Plot Smoothed Sense/Anti-sense of Specified Chromosomes
> ### Aliases: plotChr
> ### Keywords: hplot
>
> ### ** Examples
>
> example(Makesense)
Maksns> if (require("hgu133a.db")) {
Maksns+ data(expressionSet133a)
Maksns+ esetobj <- Makesense(exprs(expressionSet133a), "hgu133a")
Maksns+ esetobj2 <- Makesense(expressionSet133a[1:200, ])
Maksns+ }
Loading required package: hgu133a.db
Loading required package: org.Hs.eg.db
>
> #if (interactive())
> op <- par(ask=TRUE)
>
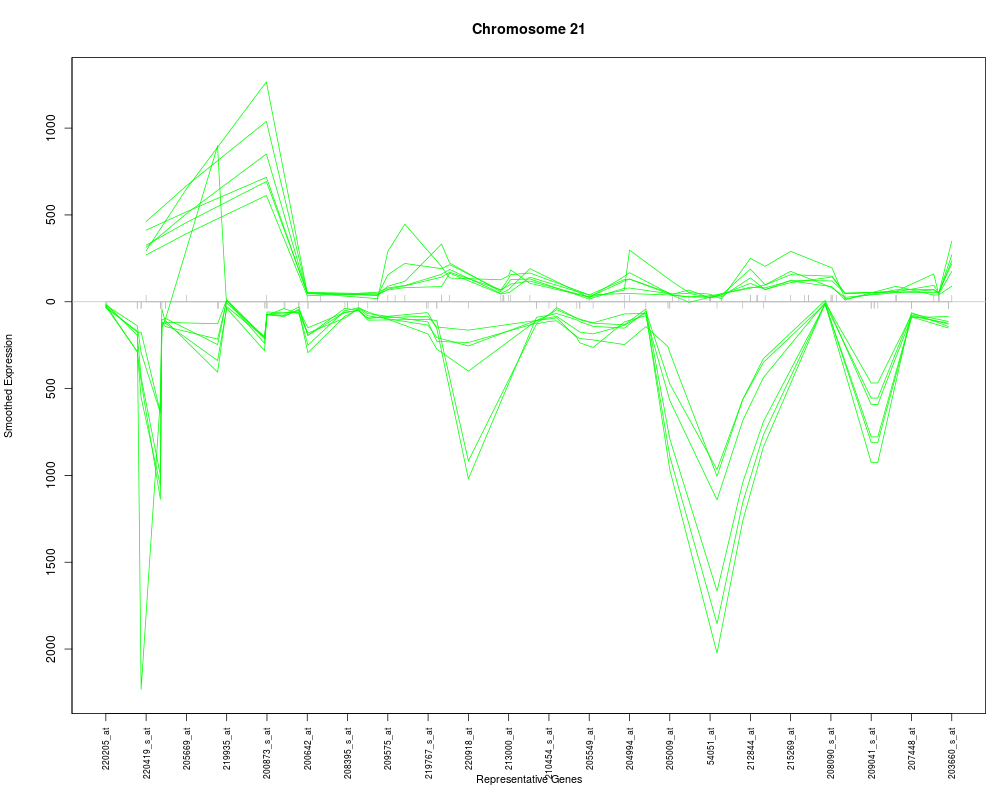
> cols <- ifelse(expressionSet133a$cov1=="test 1", "red", "green")
> plotChr("21", esetobj, cols)
>
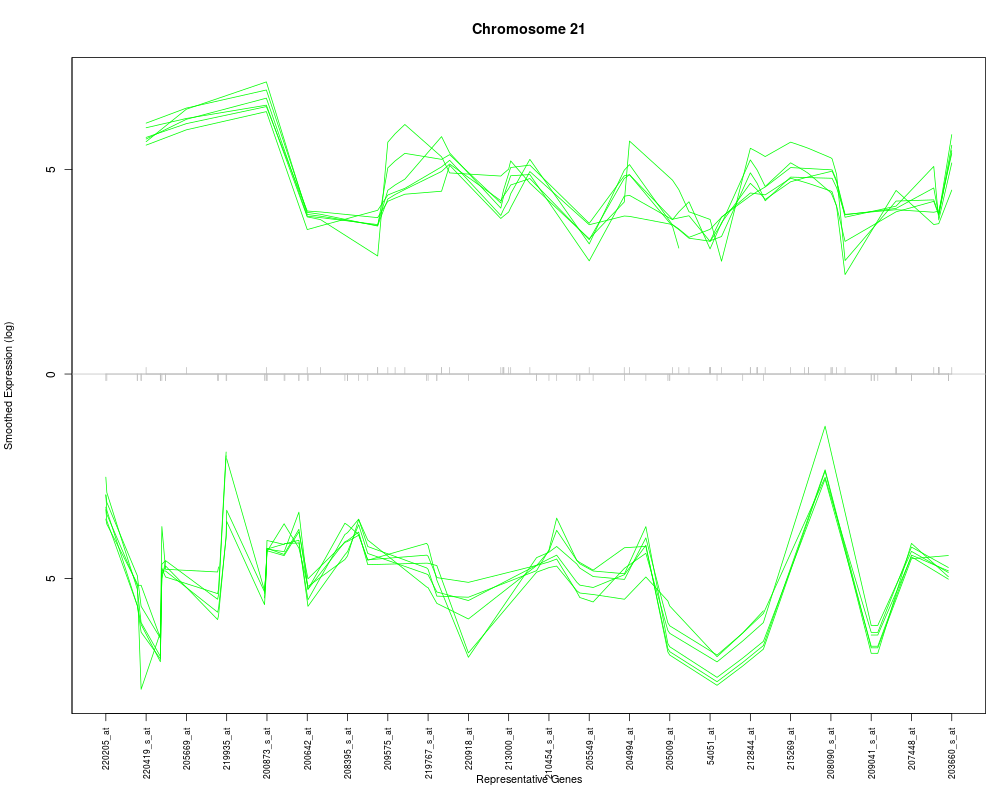
> # plot on log-scale:
>
> plotChr("21", esetobj, cols, log=TRUE)
Warning messages:
1: In log(-smooths$neg$y) : NaNs produced
2: In log(-smooths$neg$y) : NaNs produced
3: In log(-smooths$neg$y) : NaNs produced
4: In log(-smooths$neg$y) : NaNs produced
5: In log(smooths$pos$y) : NaNs produced
>
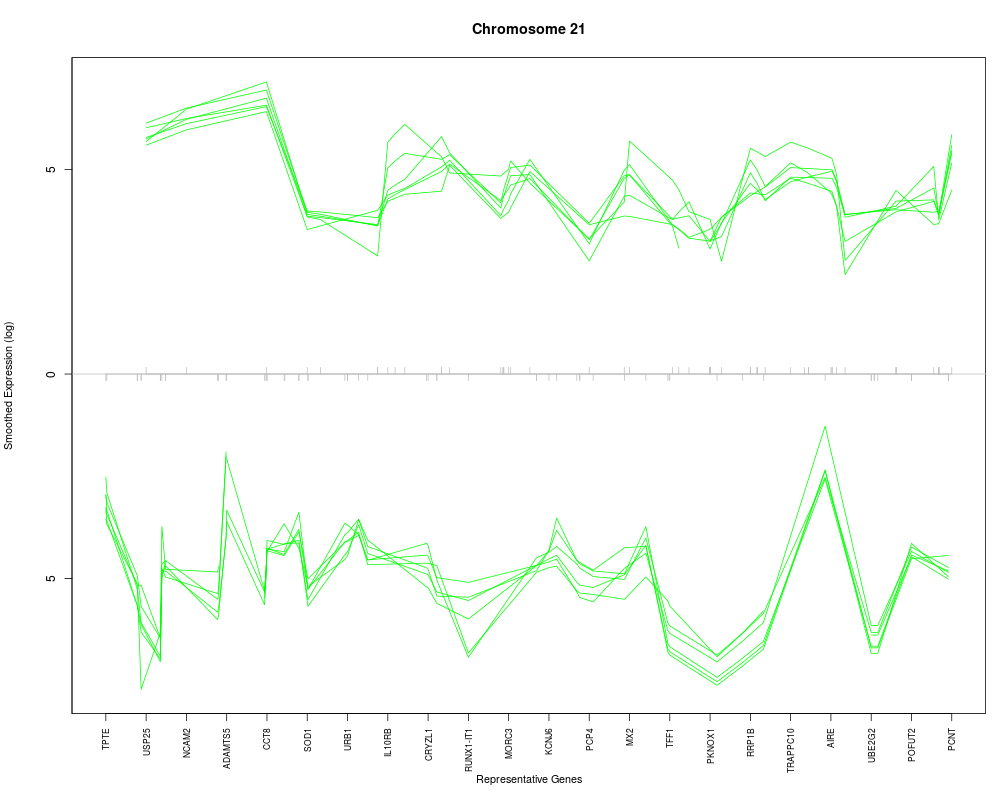
> # genesymbol instead of probe names:
>
> plotChr("21", esetobj, cols, log=TRUE, geneSymbols=TRUE)
Warning messages:
1: In log(-smooths$neg$y) : NaNs produced
2: In log(-smooths$neg$y) : NaNs produced
3: In log(-smooths$neg$y) : NaNs produced
4: In log(-smooths$neg$y) : NaNs produced
5: In log(smooths$pos$y) : NaNs produced
>
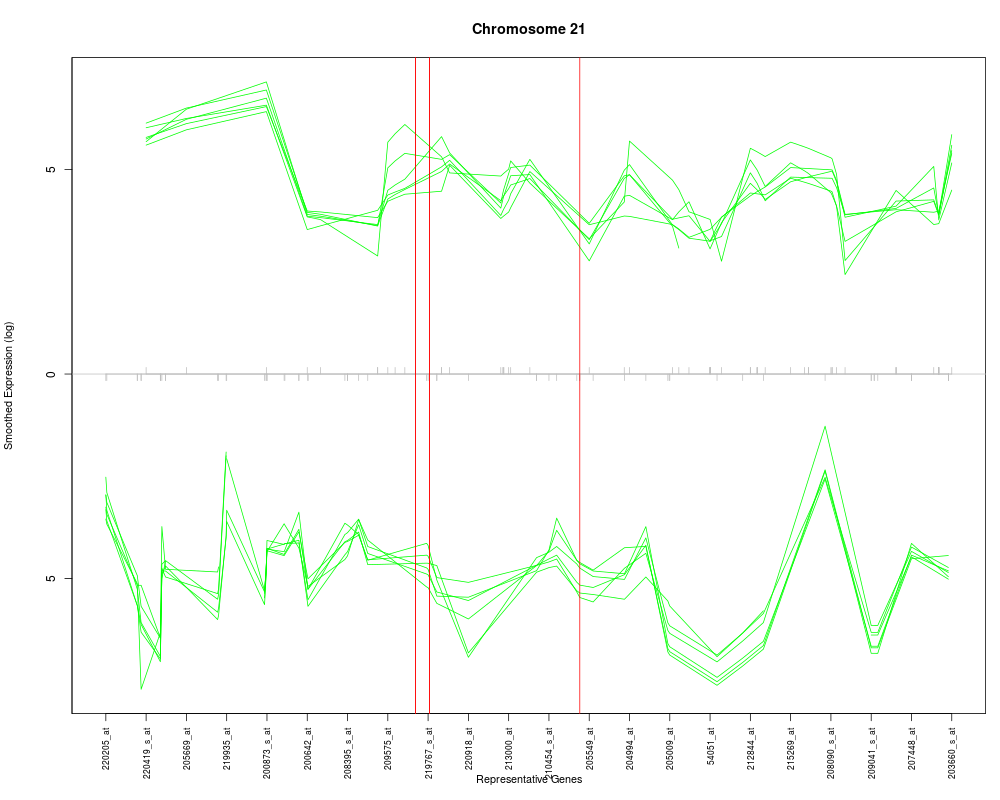
> # add vertical lines at genes of interest:
>
> gs <- c("220372_at", "35776_at", "200943_at")
> plotChr("21", esetobj, cols, log=TRUE, geneSymbols=FALSE, lines.at=gs)
Warning messages:
1: In log(-smooths$neg$y) : NaNs produced
2: In log(-smooths$neg$y) : NaNs produced
3: In log(-smooths$neg$y) : NaNs produced
4: In log(-smooths$neg$y) : NaNs produced
5: In log(smooths$pos$y) : NaNs produced
>
> # add vertical lines at genes of interest
> # with specified colors:
>
> gs <- c("220372_at", "35776_at", "200943_at")
> cc <- c("blue", "cyan","magenta")
> plotChr("21", esetobj, cols, log=TRUE, geneSymbols=FALSE, lines.at=gs,
+ lines.col=cc)
Warning messages:
1: In log(-smooths$neg$y) : NaNs produced
2: In log(-smooths$neg$y) : NaNs produced
3: In log(-smooths$neg$y) : NaNs produced
4: In log(-smooths$neg$y) : NaNs produced
5: In log(smooths$pos$y) : NaNs produced
> #if (interactive())
> par(op)
>
>
>
>
>
> dev.off()
null device
1
>
 .
.