Supported by Dr. Osamu Ogasawara and  . . |
|
Last data update: 2014.03.03 |
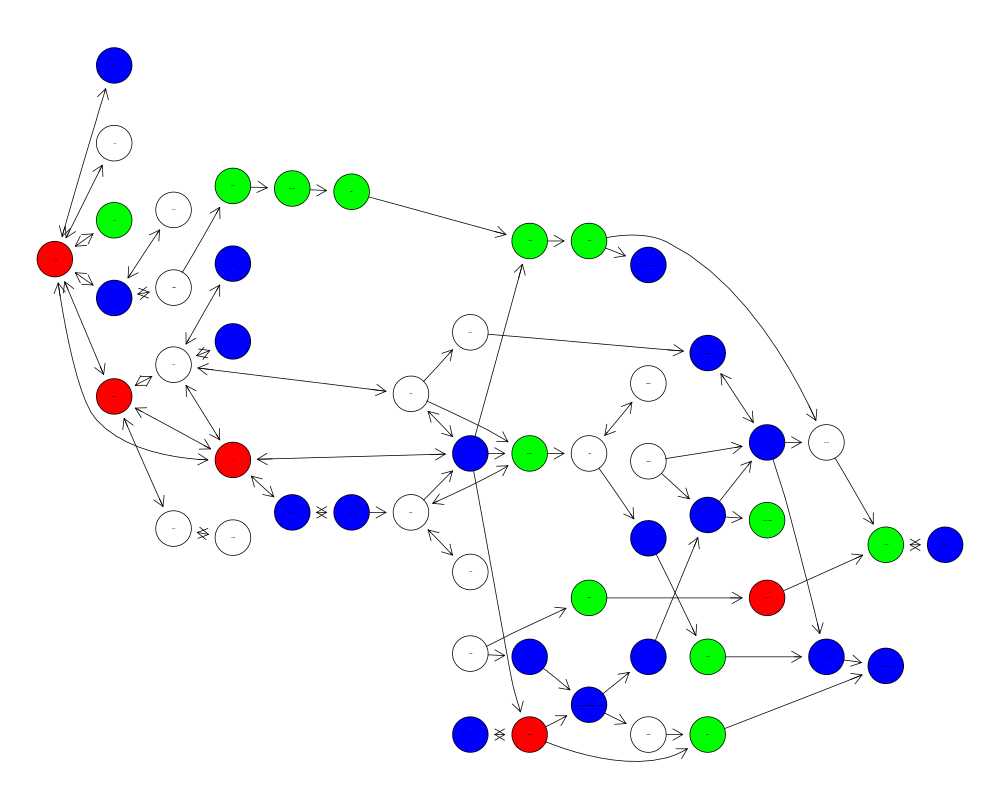
A function to plot a graph colored by expression dataDescriptionGiven a graph and expression data for one entity, will plot the graph with the nodes colored according to the expression levels provided. UsageplotExpressionGraph(graph, nodeEGmap, exprs, ENTREZIDenvir, mapFun, log = FALSE, nodeAttrs = list(), ...) Arguments
DetailsThis function can be used to plot a graph and have the nodes colored
according to expression levels provided by the user. The
The The The The The The IMCAEntrezLink data structure was created for the purpose of
illustrating this program. On Sept 24 2007, the current version
of Author(s)Jeff Gentry See Also
Examples
   if (require("Rgraphviz") && require("hgu95av2.db") &&
       require("fibroEset")) {
       data(integrinMediatedCellAdhesion)
	   data(IMCAEntrezLink)
       data(fibroEset)
       attrs <- getDefaultAttrs()
       attrs$graph$rankdir <- "LR"
       plotExpressionGraph(IMCAGraph, IMCAEntrezLink,
                           exprs(fibroEset)[,1],
                           hgu95av2ENTREZID, attrs = attrs)
   }
Results
R version 3.3.1 (2016-06-21) -- "Bug in Your Hair"
Copyright (C) 2016 The R Foundation for Statistical Computing
Platform: x86_64-pc-linux-gnu (64-bit)

R is free software and comes with ABSOLUTELY NO WARRANTY.
You are welcome to redistribute it under certain conditions.
Type 'license()' or 'licence()' for distribution details.

R is a collaborative project with many contributors.
Type 'contributors()' for more information and
'citation()' on how to cite R or R packages in publications.

Type 'demo()' for some demos, 'help()' for on-line help, or
'help.start()' for an HTML browser interface to help.
Type 'q()' to quit R.

> library(geneplotter)
Loading required package: Biobase
Loading required package: BiocGenerics
Loading required package: parallel

Attaching package: 'BiocGenerics'

The following objects are masked from 'package:parallel':

    clusterApply, clusterApplyLB, clusterCall, clusterEvalQ,
    clusterExport, clusterMap, parApply, parCapply, parLapply,
    parLapplyLB, parRapply, parSapply, parSapplyLB

The following objects are masked from 'package:stats':

    IQR, mad, xtabs

The following objects are masked from 'package:base':

    Filter, Find, Map, Position, Reduce, anyDuplicated, append,
    as.data.frame, cbind, colnames, do.call, duplicated, eval, evalq,
    get, grep, grepl, intersect, is.unsorted, lapply, lengths, mapply,
    match, mget, order, paste, pmax, pmax.int, pmin, pmin.int, rank,
    rbind, rownames, sapply, setdiff, sort, table, tapply, union,
    unique, unsplit

Welcome to Bioconductor

    Vignettes contain introductory material; view with
    'browseVignettes()'. To cite Bioconductor, see
    'citation("Biobase")', and for packages 'citation("pkgname")'.

Loading required package: lattice
Loading required package: annotate
Loading required package: AnnotationDbi
Loading required package: stats4
Loading required package: IRanges
Loading required package: S4Vectors

Attaching package: 'S4Vectors'

The following objects are masked from 'package:base':

    colMeans, colSums, expand.grid, rowMeans, rowSums

Loading required package: XML
> png(filename="/home/ddbj/snapshot/RGM3/R_BC/result/geneplotter/plotExpressionGraph.Rd_%03d_medium.png", width=480, height=480)
> ### Name: plotExpressionGraph
> ### Title: A function to plot a graph colored by expression data
> ### Aliases: plotExpressionGraph getPlotExpressionColors IMCAEntrezLink
> ###   defMapFun
> ### Keywords: utilities graphs hplot
>
> ### ** Examples
>
>    if (require("Rgraphviz") && require("hgu95av2.db") &&
+        require("fibroEset")) {
+        data(integrinMediatedCellAdhesion)
+ 	   data(IMCAEntrezLink)
+        data(fibroEset)
+        attrs <- getDefaultAttrs()
+        attrs$graph$rankdir <- "LR"
+        plotExpressionGraph(IMCAGraph, IMCAEntrezLink,
+                            exprs(fibroEset)[,1],
+                            hgu95av2ENTREZID, attrs = attrs)
+    }
Loading required package: Rgraphviz
Loading required package: graph

Attaching package: 'graph'

The following object is masked from 'package:XML':

    addNode

Loading required package: grid

Attaching package: 'Rgraphviz'

The following object is masked from 'package:annotate':

    toFile

The following objects are masked from 'package:IRanges':

    from, to

The following objects are masked from 'package:S4Vectors':

    from, to

Loading required package: hgu95av2.db
Loading required package: org.Hs.eg.db


Loading required package: fibroEset
>
>
>
>
>
> dev.off()
null device
          1
>
|