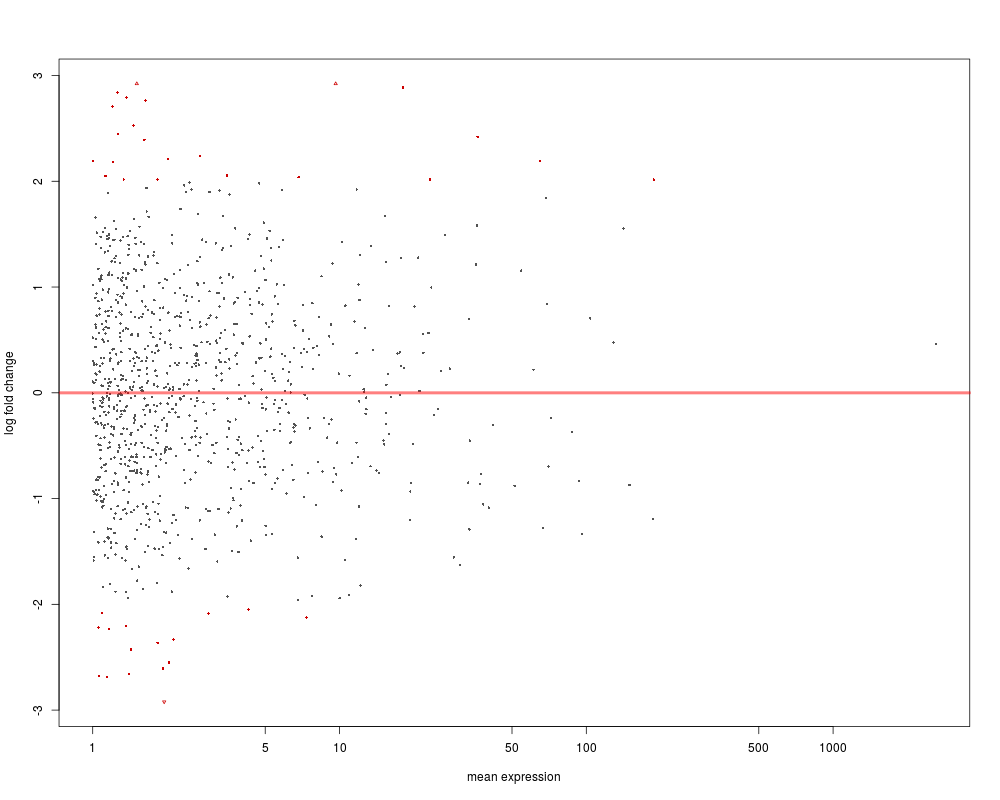
A data.frame with (at least) three columns, the first containing the
mean expression values (for the x-axis), the second the logarithmic fold change
(for the-y axis) and the third
a logical vector indicating significance (for the colouring of the dots).
ylim
The limits for the y-axis. If missing, an attempt is made to choose a sensible value.
Dots exceeding the limits will be displayed as triangles at the limits, pointing outwards.
colNonSig
colour to use for non-significant data points.
colSig
colour to use for significant data points.
colLine
colour to use for the horizontal (y=0) line.
log
which axis/axes should be logarithmic; will be passed to plot.
R version 3.3.1 (2016-06-21) -- "Bug in Your Hair"
Copyright (C) 2016 The R Foundation for Statistical Computing
Platform: x86_64-pc-linux-gnu (64-bit)

R is free software and comes with ABSOLUTELY NO WARRANTY.
You are welcome to redistribute it under certain conditions.
Type 'license()' or 'licence()' for distribution details.

R is a collaborative project with many contributors.
Type 'contributors()' for more information and
'citation()' on how to cite R or R packages in publications.

Type 'demo()' for some demos, 'help()' for on-line help, or
'help.start()' for an HTML browser interface to help.
Type 'q()' to quit R.

> library(geneplotter)
Loading required package: Biobase
Loading required package: BiocGenerics
Loading required package: parallel

Attaching package: 'BiocGenerics'

The following objects are masked from 'package:parallel':

    clusterApply, clusterApplyLB, clusterCall, clusterEvalQ,
    clusterExport, clusterMap, parApply, parCapply, parLapply,
    parLapplyLB, parRapply, parSapply, parSapplyLB

The following objects are masked from 'package:stats':

    IQR, mad, xtabs

The following objects are masked from 'package:base':

    Filter, Find, Map, Position, Reduce, anyDuplicated, append,
    as.data.frame, cbind, colnames, do.call, duplicated, eval, evalq,
    get, grep, grepl, intersect, is.unsorted, lapply, lengths, mapply,
    match, mget, order, paste, pmax, pmax.int, pmin, pmin.int, rank,
    rbind, rownames, sapply, setdiff, sort, table, tapply, union,
    unique, unsplit

Welcome to Bioconductor

    Vignettes contain introductory material; view with
    'browseVignettes()'. To cite Bioconductor, see
    'citation("Biobase")', and for packages 'citation("pkgname")'.

Loading required package: lattice
Loading required package: annotate
Loading required package: AnnotationDbi
Loading required package: stats4
Loading required package: IRanges
Loading required package: S4Vectors

Attaching package: 'S4Vectors'

The following objects are masked from 'package:base':

    colMeans, colSums, expand.grid, rowMeans, rowSums

Loading required package: XML
> png(filename="/home/ddbj/snapshot/RGM3/R_BC/result/geneplotter/plotMA.Rd_%03d_medium.png", width=480, height=480)
> ### Name: plotMA-methods
> ### Title: Generate an MA plot
> ### Aliases: plotMA plotMA-methods plotMA,data.frame-method
> ###   plotMA,ExonCountSet-method
>
> ### ** Examples
>
>   plotMA(
+     data.frame(
+       `M` = exp(rexp(1000)),
+       `A` = rnorm(1000) -> tmp,
+       `isde` = abs(tmp)>2)
+   )
>
>
>
>
>
> dev.off()
null device
          1
>
 .
.