Supported by Dr. Osamu Ogasawara and  . . |
|
Last data update: 2014.03.03 |
Copy Number AberrationDescriptionextract genotype and copy number calls for copy number aberrations, which are often observed in tumor tissues UsagegenoCNA(snpNames, chr, pos, LRR, BAF, pBs, sampleID, Para=NULL, fixPara=FALSE, cnv.only=NULL, estimate.pi.r=TRUE, estimate.pi.b=TRUE, estimate.trans.m=TRUE, outputSeg = TRUE, outputSNP=3, outputTag=sampleID, outputViterbi=FALSE, Ds=c(1e10, 1e10, rep(1e8, 7)), pBs.alpha=0.001, contamination=TRUE, normalGtp=NULL, geno.error=0.01, min.tp=1e-4, max.diff=0.1, distThreshold=1e6, transB=c(0.5,.05,.05,0.1,0.1,.05,.05,.05,.05), epsilon=0.005, K=5, maxIt=200, seg.nSNP=3, traceIt=5) Arguments
Valueresults are written into output files NoteCopy number altered regions are identified, by default, based on the SNP level copy number calls. A CNA region boundary is declared simply when the adjacent SNPs have different copy numbers. An alternative approach is to use viterbi algorithm to output the “best path”. Most time the results based on the SNP level copy number calls are the same as the results from viterbi algorithm. For the following up association studies, the SNP level information is more relevant if we examine the association SNP by SNP. Author(s)Wei Sun and Zhengzheng Tang Examples
data(snpData)
data(snpInfo)
dim(snpData)
dim(snpInfo)
snpData[1:2,]
snpInfo[1:2,]
snpInfo[c(1001,1100,10001,10200),]
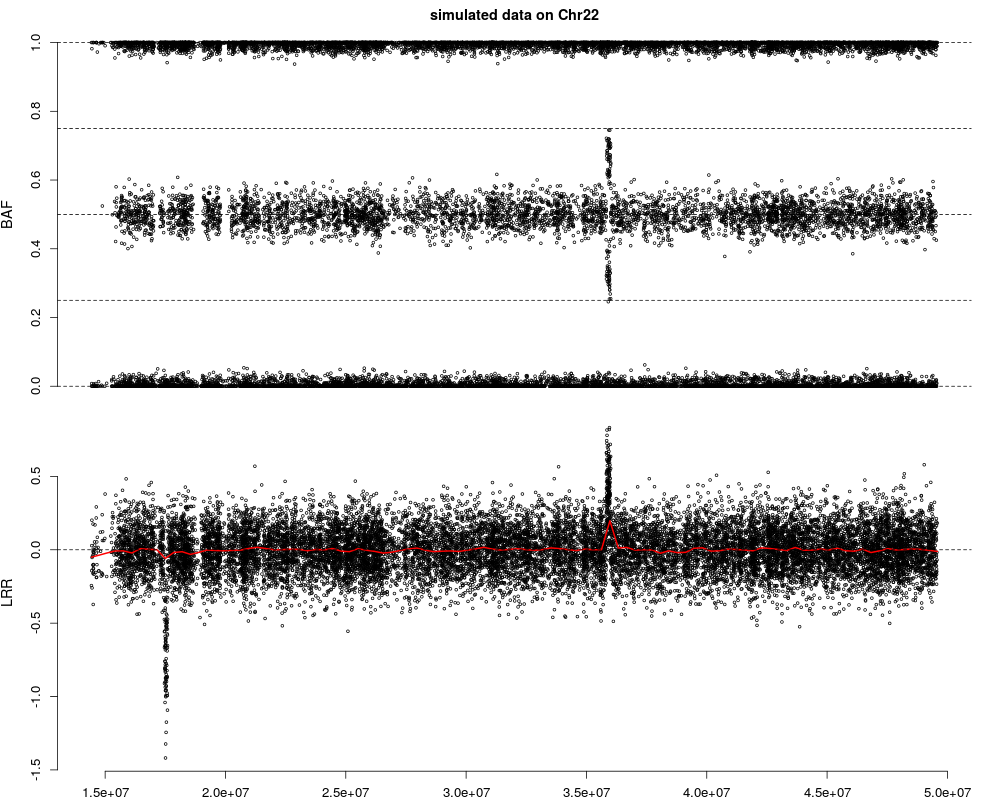
plotCN(pos=snpInfo$Position, LRR=snpData$LRR, BAF=snpData$BAF,
main = "simulated data on Chr22")
snpNames = snpInfo$Name
chr = snpInfo$Chr
pos = snpInfo$Position
LRR = snpData$LRR
BAF = snpData$BAF
pBs = snpInfo$PFB
cnv.only=(snpInfo$PFB>1)
sampleID="simu1"
# Note this simulated data is more of CNV rather than CNA.
# For example, there is no tissue contamination.
# We just use it to illustrate the usage of genoCNA.
Theta = genoCNA(snpNames, chr, pos, LRR, BAF, pBs, contamination=TRUE,
normalGtp=NULL, sampleID, cnv.only=cnv.only, outputSeg = TRUE,
outputSNP = 1, outputTag = "simu1")
Results
R version 3.3.1 (2016-06-21) -- "Bug in Your Hair"
Copyright (C) 2016 The R Foundation for Statistical Computing
Platform: x86_64-pc-linux-gnu (64-bit)

R is free software and comes with ABSOLUTELY NO WARRANTY.
You are welcome to redistribute it under certain conditions.
Type 'license()' or 'licence()' for distribution details.

R is a collaborative project with many contributors.
Type 'contributors()' for more information and
'citation()' on how to cite R or R packages in publications.

Type 'demo()' for some demos, 'help()' for on-line help, or
'help.start()' for an HTML browser interface to help.
Type 'q()' to quit R.

> library(genoCN)
> png(filename="/home/ddbj/snapshot/RGM3/R_BC/result/genoCN/genoCNA.Rd_%03d_medium.png", width=480, height=480)
> ### Name: genoCNA
> ### Title: Copy Number Aberration
> ### Aliases: genoCNA
> ### Keywords: methods
>
> ### ** Examples
>
> data(snpData)
> data(snpInfo)
>
> dim(snpData)
[1] 17348     3
> dim(snpInfo)
[1] 17348     4
>
> snpData[1:2,]
       Name        LRR         BAF
1 rs2334386 -0.2440655 1.000000000
2 rs9617528 -0.1422038 0.007824231
> snpInfo[1:2,]
             Name Chr Position   PFB
1075853 rs2334386  22 14430353 0.956
1075854 rs9617528  22 14441016 0.176
>
> snpInfo[c(1001,1100,10001,10200),]
              Name Chr Position   PFB
1076853  rs1934895  22 17460150 0.140
1076952  rs1206549  22 17595860 0.740
1085853 rs17750152  22 35827972 0.856
1086052  rs8141057  22 36007895 0.780
>
> plotCN(pos=snpInfo$Position, LRR=snpData$LRR, BAF=snpData$BAF,
+ main = "simulated data on Chr22")
>
> snpNames = snpInfo$Name
> chr = snpInfo$Chr
> pos = snpInfo$Position
> LRR = snpData$LRR
> BAF = snpData$BAF
> pBs = snpInfo$PFB
> cnv.only=(snpInfo$PFB>1)
> sampleID="simu1"
>
> # Note this simulated data is more of CNV rather than CNA.
> # For example, there is no tissue contamination.
> # We just use it to illustrate the usage of genoCNA.
>
> Theta = genoCNA(snpNames, chr, pos, LRR, BAF, pBs, contamination=TRUE,
+   normalGtp=NULL, sampleID, cnv.only=cnv.only, outputSeg = TRUE,
+             outputSNP = 1, outputTag = "simu1")
5 Wed Jul  6 16:20:37 2016
10 Wed Jul  6 16:20:42 2016
15 Wed Jul  6 16:20:47 2016
20 Wed Jul  6 16:20:52 2016
converges after 20 iterations
estimate copy number states for chromosome:

22


>
>
>
>
>
> dev.off()
null device
          1
>
|