a vector of the log R ratio, should be one-to-one
correspondence of pos
BAF
a vector of the B allele frequency, should be one-to-one
correspondence of pos
chr2plot
which chromosome to plot. Only one chromosome can be plotted
each time
sampleIDs
sample ID, could be a vector of the same length as fileNames so that different sample IDs are used for different input files.
fileNames
one or more names of the output files of genoCN or PennCNV. If it is NULL, only plot the LRR and BAF.
types
should be the same length as fileNames, indicating the type of output, currently only support "genoCN" and "pennCNV"
CNA
whether this is a copy number aberration study.
main
title of the plot
LRR.ylim
Range of y-axis for LRR plot
cex
the amount by which plotting text
and symbols should be magnified relative to the default
plot.lowess
to plot the lowess curve for LRR or not
Author(s)
Wei Sun
See Also
genoCNA, genoCNV
Examples
data(snpData)
data(snpInfo)
dim(snpData)
dim(snpInfo)
snpData[1:2,]
snpInfo[1:2,]
snpInfo[c(1001,1100,10001,10200),]
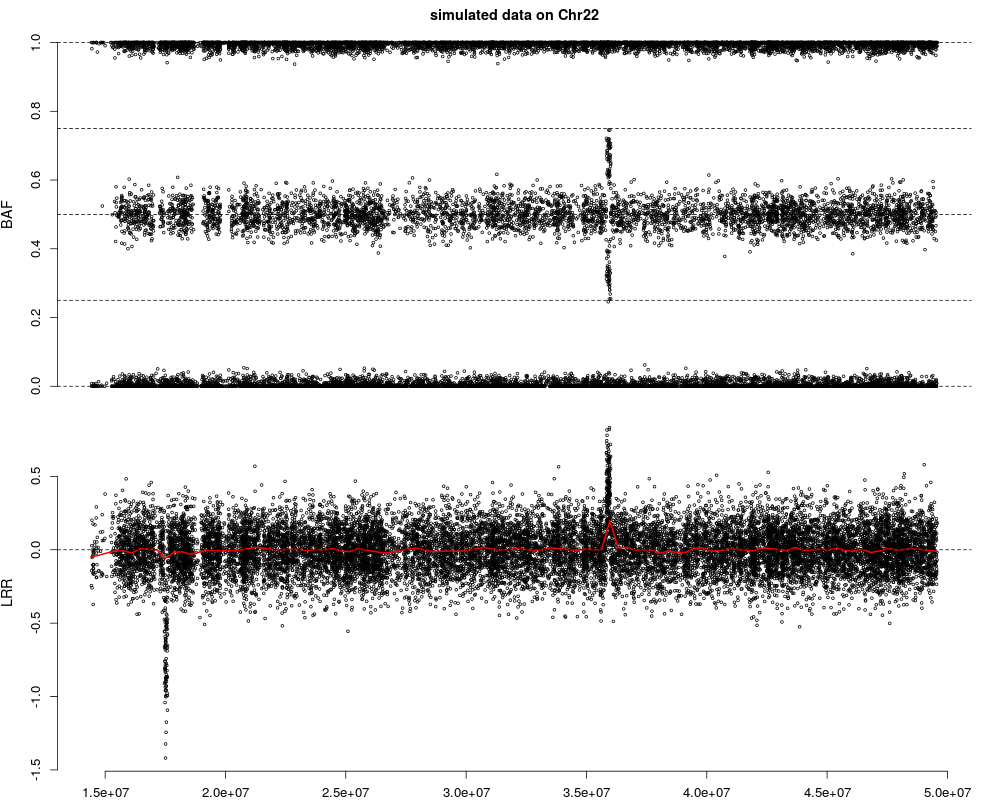
plotCN(pos=snpInfo$Position, LRR=snpData$LRR, BAF=snpData$BAF,
main = "simulated data on Chr22")
Results
R version 3.3.1 (2016-06-21) -- "Bug in Your Hair"
Copyright (C) 2016 The R Foundation for Statistical Computing
Platform: x86_64-pc-linux-gnu (64-bit)

R is free software and comes with ABSOLUTELY NO WARRANTY.
You are welcome to redistribute it under certain conditions.
Type 'license()' or 'licence()' for distribution details.

R is a collaborative project with many contributors.
Type 'contributors()' for more information and
'citation()' on how to cite R or R packages in publications.

Type 'demo()' for some demos, 'help()' for on-line help, or
'help.start()' for an HTML browser interface to help.
Type 'q()' to quit R.

> library(genoCN)
> png(filename="/home/ddbj/snapshot/RGM3/R_BC/result/genoCN/plotCN.Rd_%03d_medium.png", width=480, height=480)
> ### Name: plotCN
> ### Title: plot LRR, BAF, and the copy number estimates
> ### Aliases: plotCN
> ### Keywords: methods
>
> ### ** Examples
>
> data(snpData)
> data(snpInfo)
>
> dim(snpData)
[1] 17348     3
> dim(snpInfo)
[1] 17348     4
>
> snpData[1:2,]
       Name        LRR         BAF
1 rs2334386 -0.2440655 1.000000000
2 rs9617528 -0.1422038 0.007824231
> snpInfo[1:2,]
             Name Chr Position   PFB
1075853 rs2334386  22 14430353 0.956
1075854 rs9617528  22 14441016 0.176
>
> snpInfo[c(1001,1100,10001,10200),]
              Name Chr Position   PFB
1076853  rs1934895  22 17460150 0.140
1076952  rs1206549  22 17595860 0.740
1085853 rs17750152  22 35827972 0.856
1086052  rs8141057  22 36007895 0.780
>
> plotCN(pos=snpInfo$Position, LRR=snpData$LRR, BAF=snpData$BAF,
+ main = "simulated data on Chr22")
>
>
>
>
>
> dev.off()
null device
          1
>
 .
.