The function firsts bins each window to equal number of bins, and calculates
the a summary metrix for scores of each bin (currently, mean, max and min supported)
A scoreMatrix object can be used to draw average profiles or heatmap of read coverage
or wig track-like data. windows can be a predefined region such as CpG islands
or gene bodies that are not necessarily equi-width. Each window will be chopped to
equal number of bins based on bin.num option.
RleList, GRanges, BAM file or a bigWig file
object to be overlapped with ranges in windows
windows
GRanges object that contains the windows of interest.
It could be promoters, CpG islands, exons, introns. However,
the sizes of windows does NOT have to be equal.
bin.num
single integer value denoting how many bins there
should be for each window
bin.op
bin operation that is either one of the following strings:
"max","min","mean". The operation is applied on the
values in the bin. Defaults to "mean"
strand.aware
If TRUE (default: FALSE), the strands of the windows will
be taken into account in the resulting scoreMatrix.
If the strand of a window is -, the values of the bins
for that window will be reversed
weight.col
if the object is GRanges object a numeric column
in meta data part can be used as weights. This is particularly
useful when genomic regions have scores other than their
coverage values, such as percent methylation, conservation
scores, GC content, etc.
is.noCovNA
(Default:FALSE)
if TRUE,and if 'target' is a GRanges object with 'weight.col'
provided, the bases that are uncovered will be preserved as
NA in the returned object. This useful for situations where
you can not have coverage all over the genome, such as CpG
methylation values.
type
if target is a character vector of file paths, then type designates
the type of the corresponding files (bam or bigWig)
rpm
boolean telling whether to normalize the coverage to per milion reads.
FALSE by default. See library.size.
unique
boolean which tells the function to remove duplicated reads
based on chr, start, end and strand
extend
numeric which tells the function to extend the reads to width=extend
param
ScanBamParam object
bam.paired.end
boolean indicating whether given BAM file contains paired-end
reads (default:FALSE). Paired-reads will be treated as
fragments.
library.size
numeric indicating total number of mapped reads in a BAM file
(rpm has to be set to TRUE).
If is not given (default: NULL) then library size
is calculated using the Rsamtools package functions:
sum(countBam(BamFile(target))$records).
R version 3.3.1 (2016-06-21) -- "Bug in Your Hair"
Copyright (C) 2016 The R Foundation for Statistical Computing
Platform: x86_64-pc-linux-gnu (64-bit)
R is free software and comes with ABSOLUTELY NO WARRANTY.
You are welcome to redistribute it under certain conditions.
Type 'license()' or 'licence()' for distribution details.
R is a collaborative project with many contributors.
Type 'contributors()' for more information and
'citation()' on how to cite R or R packages in publications.
Type 'demo()' for some demos, 'help()' for on-line help, or
'help.start()' for an HTML browser interface to help.
Type 'q()' to quit R.
> library(genomation)
Loading required package: grid
> png(filename="/home/ddbj/snapshot/RGM3/R_BC/result/genomation/ScoreMatrixBin-methods.Rd_%03d_medium.png", width=480, height=480)
> ### Name: ScoreMatrixBin
> ### Title: Get bin score for bins on each window
> ### Aliases: ScoreMatrixBin ScoreMatrixBin,GRanges,GRanges-method
> ### ScoreMatrixBin,RleList,GRanges-method
> ### ScoreMatrixBin,character,GRanges-method
>
> ### ** Examples
>
> data(cage)
> data(cpgi)
> data(promoters)
> myMat=ScoreMatrixBin(target=cage,
+ windows=cpgi,bin.num=10,bin.op="mean",weight.col="tpm")
> ## No test:
> plot(colMeans(myMat,na.rm=TRUE),type="l")
> ## End(No test)
>
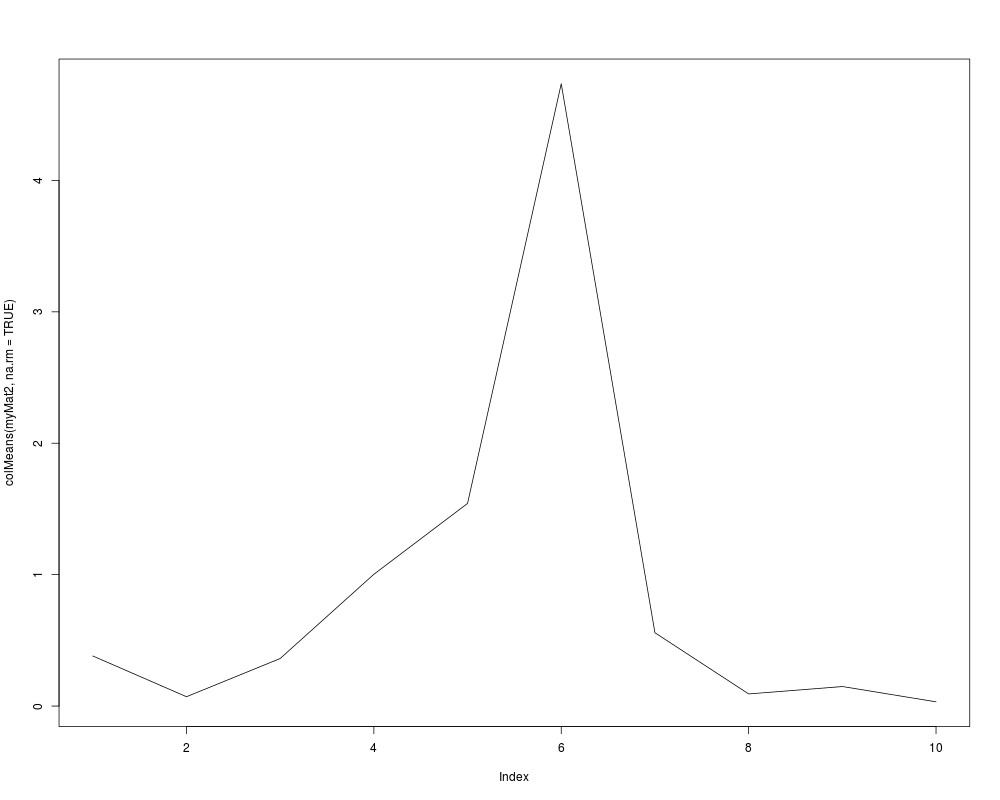
> myMat2=ScoreMatrixBin(target=cage,
+ windows=promoters,bin.num=10,bin.op="mean",
+ weight.col="tpm",strand.aware=TRUE)
> ## No test:
> plot(colMeans(myMat2,na.rm=TRUE),type="l")
> ## End(No test)
>
>
>
>
>
> dev.off()
null device
1
>
 .
.