The function constructs a list of ScoreMatrix objects in the form
of ScoreMatrixList object. This object can be visualized using
multiHeatMatrix, heatMeta or plotMeta
can be a list of scoreMatrix objects, that are coerced
to the ScoreMatrixList, a list of RleList objects, or a
character vector specifying the locations of mulitple bam files or
bigWig files that
are used to construct the scoreMatrixList. If it is either a
RleList object or a character vector of files, it is obligatory to
give a windows argument.
windows
GenomicRanges containing viewpoints for the scoreMatrix
or ScoreMatrixList functions
bin.num
an integer telling the number of bins to bin the score matrix
bin.op
an name of the function that will be used for smoothing windows of ranges
strand.aware
a boolean telling the function whether to reverse the
coverage of ranges that come from - strand (e.g. when plotting
enrichment around transcription start sites)
weight.col
if the object is GRanges object a numeric column
in meta data part can be used as weights. This is particularly
useful when genomic regions have scores other than their
coverage values, such as percent methylation, conservation
scores, GC content, etc.
is.noCovNA
(Default:FALSE)
if TRUE,and if 'targets' is a GRanges object with 'weight.col'
provided, the bases that are uncovered will be preserved as
NA in the returned object. This useful for situations where
you can not have coverage all over the genome, such as CpG
methylation values.
type
if targets is a character vector of file paths, then type
designates the type of the corresponding files (bam or bigWig)
rpm
boolean telling whether to normalize the coverage to per milion reads.
FALSE by default. See library.size.
unique
boolean which tells the function to remove duplicated reads
based on chr, start, end and strand
extend
numeric which tells the function to extend the features
( i.e aligned reads) to total
length ofwidth+extend
param
ScanBamParam object
library.size
a numeric vector of the same length as targets
indicating total number of mapped reads in BAM files (targets).
If is not given (default: NULL) then library sizes for every target
is calculated using the Rsamtools package functions:
sum(countBam(BamFile(target))$records).
rpm argument has to be set to TRUE.
cores
the number of cores to use (default: 1)
Value
returns a ScoreMatrixList object
Examples
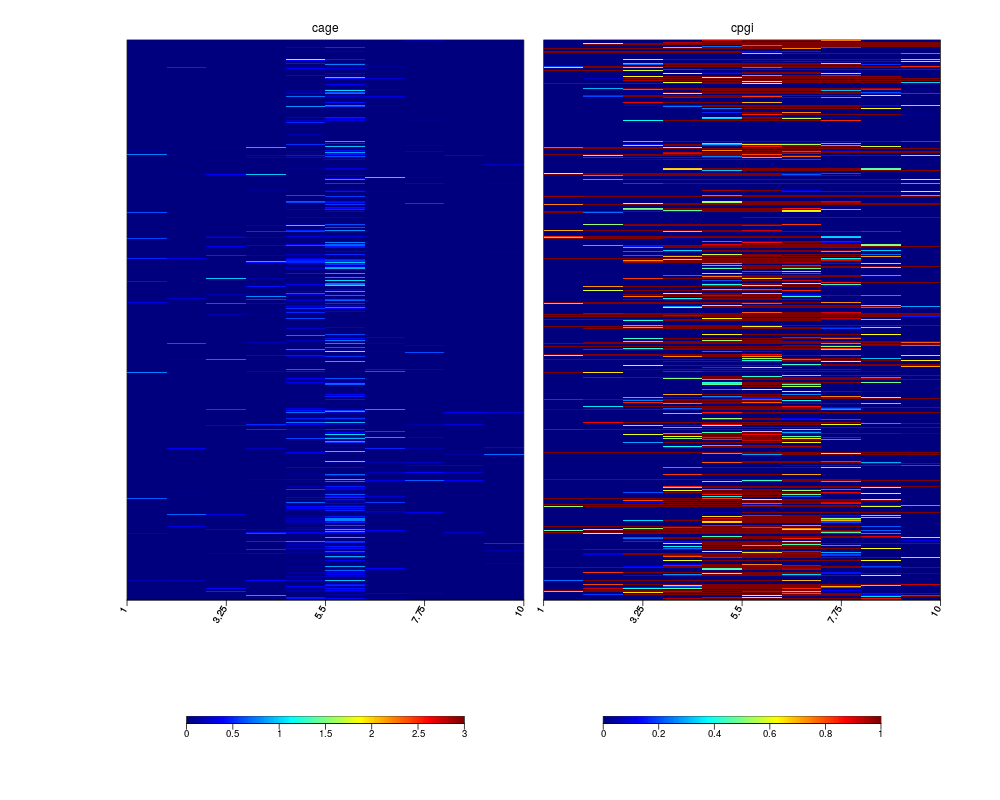
# visualize the distribution of cage clusters and cpg islands around promoters
library(GenomicRanges)
data(cage)
data(cpgi)
data(promoters)

cage$tpm = NULL
targets = GRangesList(cage=cage, cpgi=cpgi)
sml = ScoreMatrixList(targets, promoters, bin.num=10, strand.aware=TRUE)
sml

multiHeatMatrix(sml)
Results
R version 3.3.1 (2016-06-21) -- "Bug in Your Hair"
Copyright (C) 2016 The R Foundation for Statistical Computing
Platform: x86_64-pc-linux-gnu (64-bit)

R is free software and comes with ABSOLUTELY NO WARRANTY.
You are welcome to redistribute it under certain conditions.
Type 'license()' or 'licence()' for distribution details.

R is a collaborative project with many contributors.
Type 'contributors()' for more information and
'citation()' on how to cite R or R packages in publications.

Type 'demo()' for some demos, 'help()' for on-line help, or
'help.start()' for an HTML browser interface to help.
Type 'q()' to quit R.

> library(genomation)
Loading required package: grid
> png(filename="/home/ddbj/snapshot/RGM3/R_BC/result/genomation/ScoreMatrixList-methods.Rd_%03d_medium.png", width=480, height=480)
> ### Name: ScoreMatrixList
> ### Title: Make ScoreMatrixList from multiple targets
> ### Aliases: ScoreMatrixList
>
> ### ** Examples
>
> # visualize the distribution of cage clusters and cpg islands around promoters
> library(GenomicRanges)
Loading required package: BiocGenerics
Loading required package: parallel

Attaching package: 'BiocGenerics'

The following objects are masked from 'package:parallel':

    clusterApply, clusterApplyLB, clusterCall, clusterEvalQ,
    clusterExport, clusterMap, parApply, parCapply, parLapply,
    parLapplyLB, parRapply, parSapply, parSapplyLB

The following objects are masked from 'package:stats':

    IQR, mad, xtabs

The following objects are masked from 'package:base':

    Filter, Find, Map, Position, Reduce, anyDuplicated, append,
    as.data.frame, cbind, colnames, do.call, duplicated, eval, evalq,
    get, grep, grepl, intersect, is.unsorted, lapply, lengths, mapply,
    match, mget, order, paste, pmax, pmax.int, pmin, pmin.int, rank,
    rbind, rownames, sapply, setdiff, sort, table, tapply, union,
    unique, unsplit

Loading required package: S4Vectors
Loading required package: stats4

Attaching package: 'S4Vectors'

The following objects are masked from 'package:base':

    colMeans, colSums, expand.grid, rowMeans, rowSums

Loading required package: IRanges
Loading required package: GenomeInfoDb
> data(cage)
> data(cpgi)
> data(promoters)
>
> cage$tpm = NULL
> targets = GRangesList(cage=cage, cpgi=cpgi)
> sml = ScoreMatrixList(targets, promoters, bin.num=10, strand.aware=TRUE)
working on cage
working on cpgi
> sml
scoreMatrixlist of length:2

1. scoreMatrix with dims: 1055 10
2. scoreMatrix with dims: 1055 10
> ## No test:
> multiHeatMatrix(sml)
> ## End(No test)
>
>
>
>
>
> dev.off()
null device
          1
>
 .
.