The function makes a heatmap out of given ScoreMatrix object. If desired
it can use clustering using given clustering function
(e.g. k-means) and plot cluster color codes as a sidebar.
In addition, user can define groups of rows using 'group' argument.
if TRUE, grid graphics will be used. if FALSE, base graphics
will be used on the top level, so users can use par(mfrow)
or par(mfcol) prior to calling the function. Default:FALSE
col
a vector of colors, such as the ones created by heat.colors(10).
If NULL (which is default), jet color scheme (common in matlab
plots) will be used.
xcoords
a vector of numbers showing relative positions of the bases or
windows. It must match the number of columns in the ScoreMatrix.
Alternatively, it could be a numeric vector of two elements. Such
as c(0,100) showing the relative start and end coordinates of the first
and last column of the ScoreMatrix object.
group
a list of vectors of row numbers or a factor. This grouping is
used for rowside colors of the heatmap. If it is a list,
each element of the list must be a vector of row numbers. Names
of the elements of the list will be used as names of groups.
If group is a factor
, it's length must match the number of rows of the matrix, and
factor levels will be used as the names of the groups in the plot.
group.col
a vector of color names to be used at the rowside colors if
group argument is given or clustfun function is given.
order
Logical indicating if the rows should be ordered or not
(Default:FALSE). If order=TRUE the matrix will be ordered
with rowSums(mat) values in descending order.
If group argument is provided, first the groups
will be ordered in descending order of sums of rows then, everything
within the clusters will be ordered by sums of rows.
If clustfun is given then rows within clusters
will be order in descending order of sums of rows.
user.order
a numerical vector indicating the order of groups/clusters (it works only
when group or clustfun argument is given).
winsorize
Numeric vector of two, defaults to c(0,100). This vector
determines the upper and lower percentile values to limit the
extreme values. For example, c(0,99) will limit the values to
only 99th percentile, everything above the 99 percentile will
be equalized to the value of 99th percentile.This is useful
for visualization of matrices that have outliers.
clustfun
a function for clustering
rows of mat that returns
a vector of integers indicating the cluster to which
each point is allocated (a vector of cluster membership),
e.g. k-means algorithm with 3 centers:
function(x) kmeans(x, centers=3)$cluster.
By default FALSE.
main
a character string for the plot title
legend.name
a character label plotted next to the legend
cex.legend
A numerical value giving the amount by which
legend axis marks should be magnified relative to the default
xlab
label a character string for x-axis of the heatmap
cex.main
A numerical value giving the amount by which
plot title should be magnified
cex.lab
A numerical value giving the amount by which
axis labels (including 'legend.name')
should be magnified relative to the default.
cex.axis
A numerical value giving the amount by which
axis marks should be magnified relative to the default
newpage
logical indicating if grid.newpage() function should be
invoked if grid=TRUE.
Value
returns clustering result invisibly, if clustfun is definied
Examples
data(cage)
data(promoters)
scores1=ScoreMatrix(target=cage,windows=promoters,strand.aware=TRUE,
weight.col="tpm")
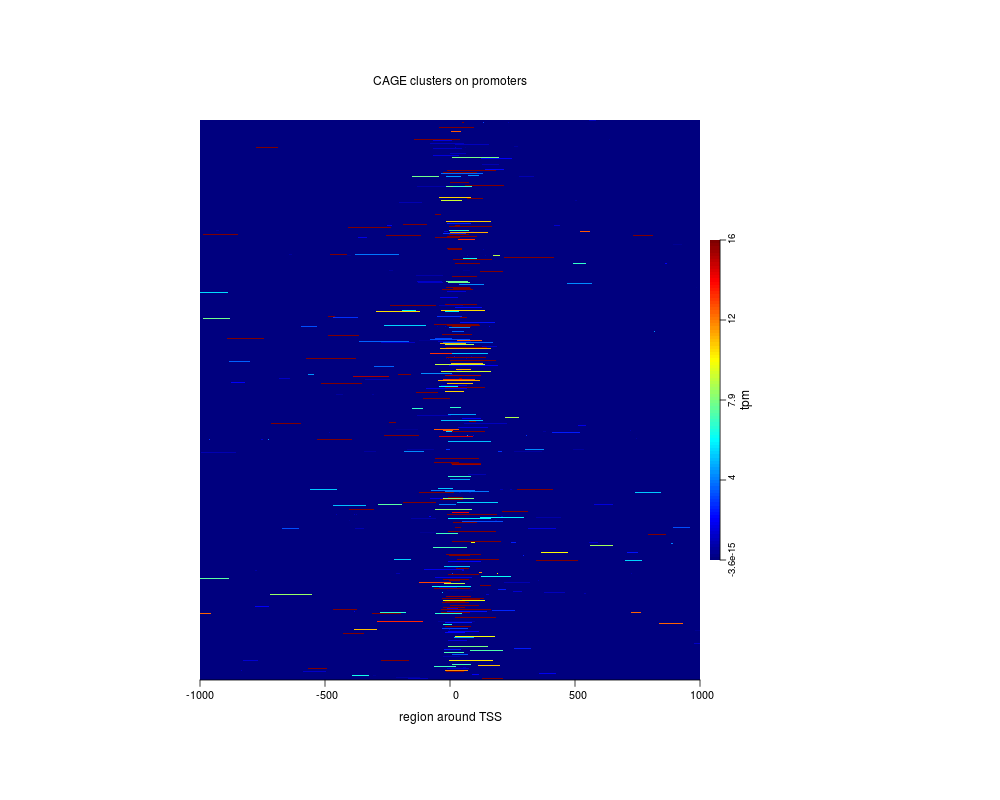
set.seed(1000)
heatMatrix(mat=scores1,legend.name="tpm",winsorize=c(0,99),xlab="region around TSS",
xcoords=-1000:1000,
cex.legend=0.8,main="CAGE clusters on promoters",cex.lab=1,
cex.axis=0.9,grid=FALSE)
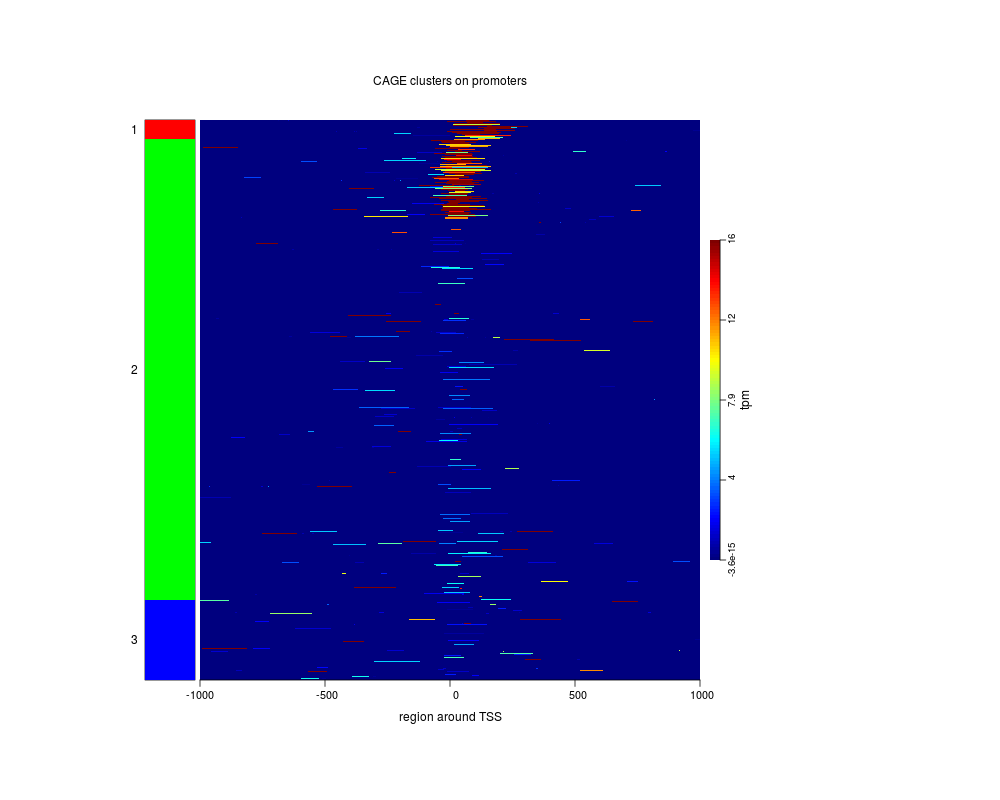
## examples using clustering functions
## k-means
cl1 <- function(x) kmeans(x, centers=3)$cluster
set.seed(1000)
heatMatrix(mat=scores1,legend.name="tpm",winsorize=c(0,99),xlab="region around TSS",
xcoords=-1000:1000,clustfun=cl1,
cex.legend=0.8,main="CAGE clusters on promoters",cex.lab=1,
cex.axis=0.9,grid=FALSE,
user.order=c(1,3,2))
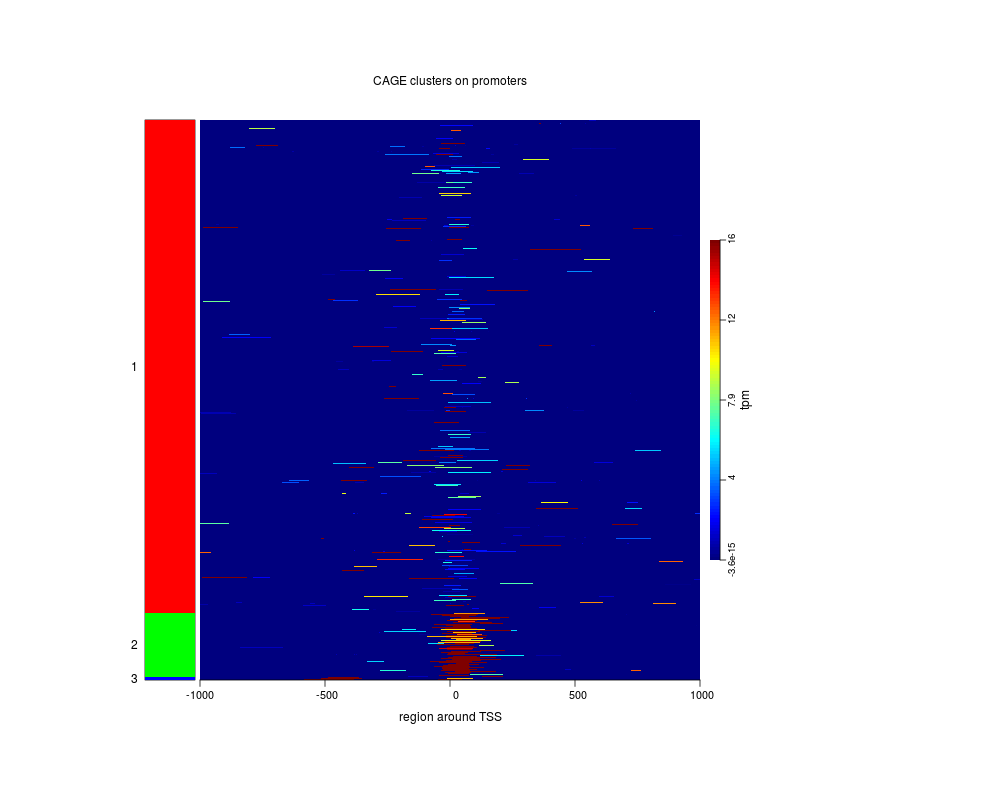
## hierarchical clustering
cl2 <- function(x) cutree(hclust(dist(x), method="complete"), k=3)
set.seed(1000)
heatMatrix(mat=scores1,legend.name="tpm",winsorize=c(0,99),xlab="region around TSS",
xcoords=-1000:1000,clustfun=cl2,
cex.legend=0.8,main="CAGE clusters on promoters",cex.lab=1,
cex.axis=0.9,grid=FALSE)
Results
R version 3.3.1 (2016-06-21) -- "Bug in Your Hair"
Copyright (C) 2016 The R Foundation for Statistical Computing
Platform: x86_64-pc-linux-gnu (64-bit)

R is free software and comes with ABSOLUTELY NO WARRANTY.
You are welcome to redistribute it under certain conditions.
Type 'license()' or 'licence()' for distribution details.

R is a collaborative project with many contributors.
Type 'contributors()' for more information and
'citation()' on how to cite R or R packages in publications.

Type 'demo()' for some demos, 'help()' for on-line help, or
'help.start()' for an HTML browser interface to help.
Type 'q()' to quit R.

> library(genomation)
Loading required package: grid
> png(filename="/home/ddbj/snapshot/RGM3/R_BC/result/genomation/heatMatrix.Rd_%03d_medium.png", width=480, height=480)
> ### Name: heatMatrix
> ### Title: Draw a heatmap of a given ScoreMatrix object
> ### Aliases: heatMatrix
>
> ### ** Examples
>
> data(cage)
> data(promoters)
> scores1=ScoreMatrix(target=cage,windows=promoters,strand.aware=TRUE,
+                    weight.col="tpm")
>
> set.seed(1000)
> ## No test:
> heatMatrix(mat=scores1,legend.name="tpm",winsorize=c(0,99),xlab="region around TSS",
+            xcoords=-1000:1000,
+            cex.legend=0.8,main="CAGE clusters on promoters",cex.lab=1,
+            cex.axis=0.9,grid=FALSE)
>
> ## examples using clustering functions
> ## k-means
> cl1 <- function(x) kmeans(x, centers=3)$cluster
> set.seed(1000)
> heatMatrix(mat=scores1,legend.name="tpm",winsorize=c(0,99),xlab="region around TSS",
+          xcoords=-1000:1000,clustfun=cl1,
+          cex.legend=0.8,main="CAGE clusters on promoters",cex.lab=1,
+          cex.axis=0.9,grid=FALSE,
+          user.order=c(1,3,2))
>
> ## hierarchical clustering
> cl2 <- function(x) cutree(hclust(dist(x), method="complete"), k=3)
> set.seed(1000)
> heatMatrix(mat=scores1,legend.name="tpm",winsorize=c(0,99),xlab="region around TSS",
+          xcoords=-1000:1000,clustfun=cl2,
+          cex.legend=0.8,main="CAGE clusters on promoters",cex.lab=1,
+          cex.axis=0.9,grid=FALSE)
> ## End(No test)
>
>
>
>
>
> dev.off()
null device
          1
>
 .
.