R: Draw multiple heatmaps from a ScoreMatrixList object
multiHeatMatrix
R Documentation
Draw multiple heatmaps from a ScoreMatrixList object
Description
The function plots multiple heatmaps for a ScoreMatrixList object side by side.
Each matrix can have different color schemes but it is essential that each matrix
is obtained from same regions or neighbouring regions.
if TRUE, grid graphics will be used. if FALSE, base graphics
will be used on the top level, so users can use par(mfrow)
or par(mfcol) prior to calling the function. Default:FALSE
col
a color palette or list of color palettes, such as
list(heat.colors(10),topo.colors(10)). If it is a list,
it is length must match the number of matrices to be plotted.
If it is a single palette
every heatmap will have the same colors.
xcoords
a vector of numbers showing relative positions of the bases or
windows or a list of vectors.
The elements of the list must match the number of columns in the
corresponding ScoreMatrix.
Alternatively, the elements could be a numeric vector of two elements. Such
as c(0,100) showing the relative start and end coordinates of the first
and last column of the ScoreMatrix object. The remaining
coordinates will be automatically matched in this case. If the
argument is not a list but a single vector, then all heatmaps
will have the same coordinate on their x-axis.
group
a list of vectors of row numbers or a factor. The rows will be
reordered to match their grouping. The grouping is
used for rowside colors of the heatmap. If it is a list,
each element of the list must be a vector of row numbers. Names
of the elements of the list will be used as names of groups.
If group is a factor
, it's length must match the number of rows of the matrix, and
factor levels will be used as the names of the groups in the plot.
group.col
a vector of color names to be used at the rowside colors if
group and clustfun arguments are given
order
Logical indicating if the rows should be ordered or not
(Default:FALSE). If order=TRUE the matrix will be ordered
with rowSums(mat) values in descending order.
If group argument is provided, first the groups
will be ordered in descending order of sums of rows then, everything
within the clusters will be ordered by sums of rows.
If clustfun is given then rows within clusters
will be order in descending order by sums of rows.
user.order
a numerical vector indicating the order of groups/clusters (it works only
when group or clustfun argument is given).
winsorize
Numeric vector of two, defaults to c(0,100). This vector
determines the upper and lower percentile values to limit the
extreme values. For example, c(0,99) will limit the values to
only 99th percentile for a matrix,
everything above the 99 percentile will
be equalized to the value of 99th percentile.This is useful
for visualization of matrices that have outliers.
clustfun
a function for clustering
rows of mat that returns
a vector of integers indicating the cluster to which
each point is allocated (a vector of cluster membership),
e.g. k-means algorithm with 3 centers:
function(x) kmeans(x, centers=3)$cluster.
By default FALSE.
clust.matrix
a numerical vector of indexes or a character vector of names
of the ScoreMatrix objects in 'sml'
to be used in clustering (if clustfun argument is provided).
By default all matrices are clustered. Matrices that are
not indicated in clust.matrix are ordered according to
result of clustering algorithm.
column.scale
Logical indicating if matrices should be scaled or not,
prior to clustering or ordering. Setting this
to TRUE scales the columns of the
matrices using,
scale() function. scaled columns are only used for
clustering or ordering. Original scores are displayed for heatmaps.
matrix.main
a vector of strings for the titles of the heatmaps. If NULL
titles will be obtained from names of the ScoreMatrix
objects in the ScoreMatrixList objects.
common.scale
if TRUE (Default:FALSE) all the heatmap colors will be
coming from the same score
scale, although each heatmap color scale can be different.
The color intensities will be coming from the same scale.
The scale will be
determined by minimum of all matrices and maximum of all
matrices. This is useful when all matrices are on the same
score scale. If FALSE, the color scale will be determined
by minimum and maximum of each matrix individually.
legend
if TRUE and color legend for the heatmap is drawn.
legend.name
a vector of legend labels to be plotted with legends
of each heatmap. If it is a length 1 vector, all heatmaps
will have the same legend label.
cex.legend
A numerical value giving the amount by which
legend axis marks should be magnified relative to the default
xlab
a vector of character strings for x-axis labels of the heatmaps.
if it is length 1, all heatmaps will have the same label.
cex.lab
A numerical value giving the amount by which
axis labels (including 'legend.name')
should be magnified relative to the default.
cex.main
A numerical value giving the amount by which
plot title should be magnified
cex.axis
A numerical value giving the amount by which
axis marks should be magnified relative to the default
newpage
logical indicating if grid.newpage() function should be
invoked if grid=TRUE.
Value
invisibly returns the order of rows, if clustfun is provided and/or order=TRUE
Examples
data(cage)
data(promoters)
scores1=ScoreMatrix(target=cage,windows=promoters,strand.aware=TRUE)
data(cpgi)
scores2=ScoreMatrix(target=cpgi,windows=promoters,strand.aware=TRUE)
sml=new("ScoreMatrixList",list(a=scores1,b=scores2))
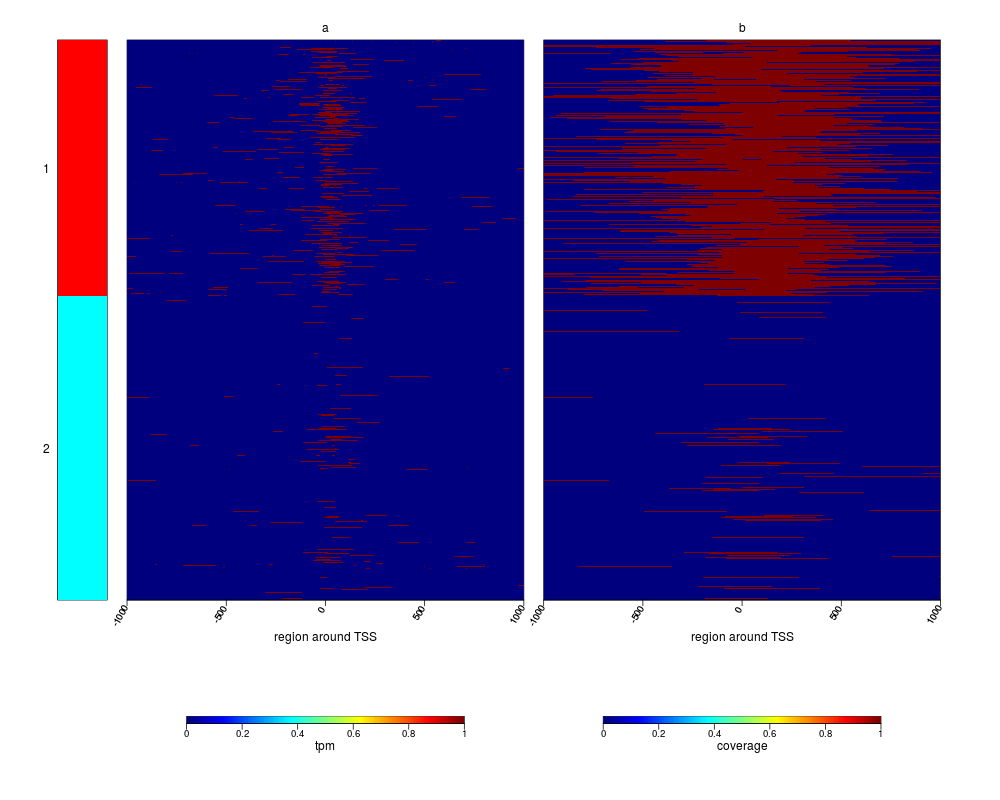
# use with k-means
multiHeatMatrix(sml,
clustfun=function(x) kmeans(x, centers=2)$cluster,
cex.axis=0.8,xcoords=c(-1000,1000),
winsorize=c(0,99),
legend.name=c("tpm","coverage"),xlab="region around TSS")
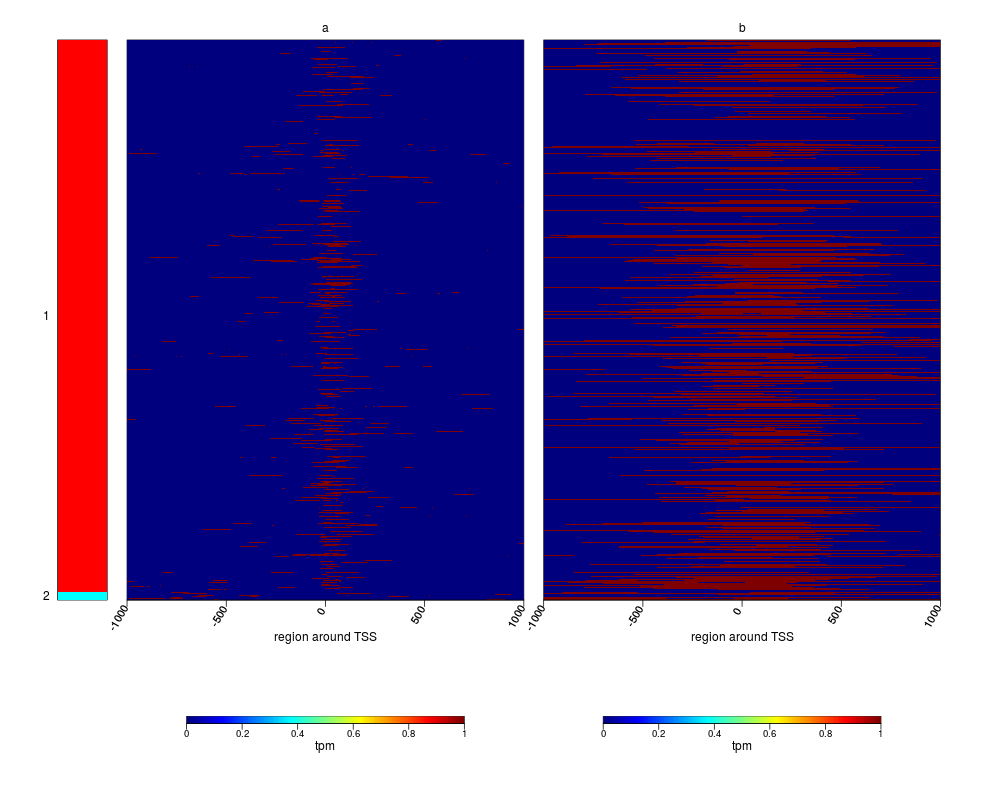
# use with hierarchical clustering
cl2 <- function(x) cutree(hclust(dist(x), method="complete"), k=2)
multiHeatMatrix(sml,legend.name="tpm",winsorize=c(0,99),xlab="region around TSS",
xcoords=-1000:1000,clustfun=cl2,
cex.legend=0.8,cex.lab=1,
cex.axis=0.9,grid=FALSE)
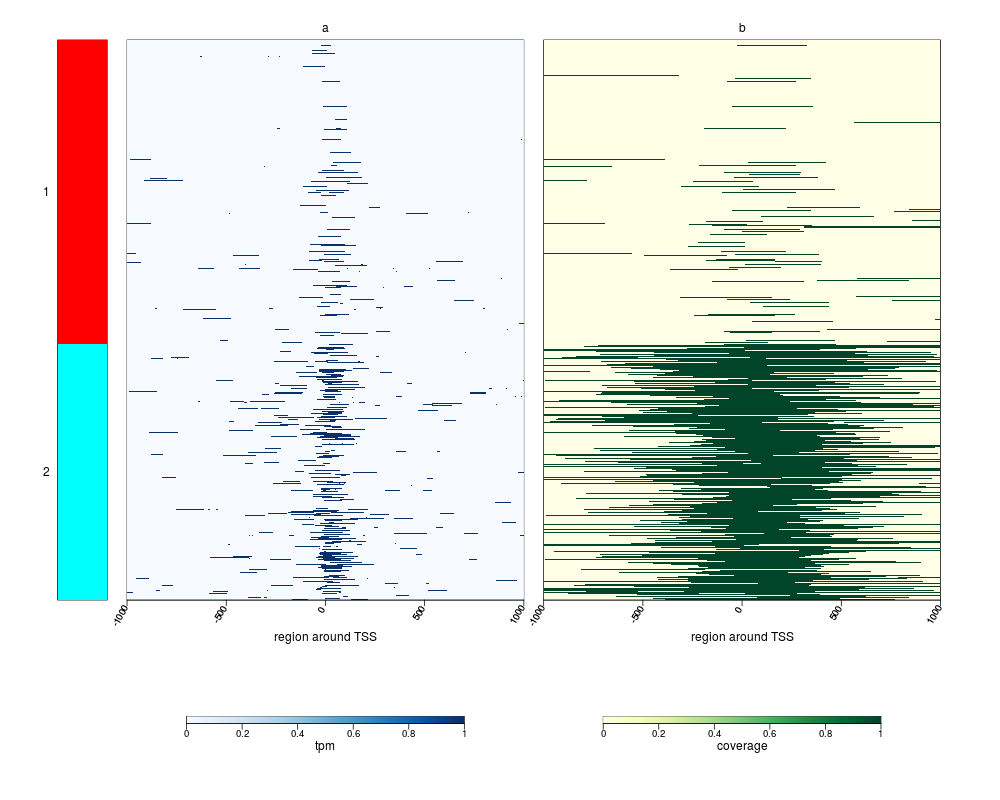
# use different colors
require(RColorBrewer)
col.cage= brewer.pal(9,"Blues")
col.cpgi= brewer.pal(9,"YlGn")
multiHeatMatrix(sml,
clustfun=function(x) kmeans(x, centers=2)$cluster,
cex.axis=0.8,xcoords=c(-1000,1000),
winsorize=c(0,99),col=list(col.cage,col.cpgi),
legend.name=c("tpm","coverage"),xlab="region around TSS")
Results
R version 3.3.1 (2016-06-21) -- "Bug in Your Hair"
Copyright (C) 2016 The R Foundation for Statistical Computing
Platform: x86_64-pc-linux-gnu (64-bit)

R is free software and comes with ABSOLUTELY NO WARRANTY.
You are welcome to redistribute it under certain conditions.
Type 'license()' or 'licence()' for distribution details.

R is a collaborative project with many contributors.
Type 'contributors()' for more information and
'citation()' on how to cite R or R packages in publications.

Type 'demo()' for some demos, 'help()' for on-line help, or
'help.start()' for an HTML browser interface to help.
Type 'q()' to quit R.

> library(genomation)
Loading required package: grid
> png(filename="/home/ddbj/snapshot/RGM3/R_BC/result/genomation/multiHeatMatrix.Rd_%03d_medium.png", width=480, height=480)
> ### Name: multiHeatMatrix
> ### Title: Draw multiple heatmaps from a ScoreMatrixList object
> ### Aliases: multiHeatMatrix
>
> ### ** Examples
>
> data(cage)
> data(promoters)
> scores1=ScoreMatrix(target=cage,windows=promoters,strand.aware=TRUE)
>
> data(cpgi)
> scores2=ScoreMatrix(target=cpgi,windows=promoters,strand.aware=TRUE)
>
> sml=new("ScoreMatrixList",list(a=scores1,b=scores2))
>
> # use with k-means
> ## No test:
> multiHeatMatrix(sml,
+                  clustfun=function(x) kmeans(x, centers=2)$cluster,
+                  cex.axis=0.8,xcoords=c(-1000,1000),
+                  winsorize=c(0,99),
+                  legend.name=c("tpm","coverage"),xlab="region around TSS")
>
> # use with hierarchical clustering
> cl2 <- function(x) cutree(hclust(dist(x), method="complete"), k=2)
> multiHeatMatrix(sml,legend.name="tpm",winsorize=c(0,99),xlab="region around TSS",
+          xcoords=-1000:1000,clustfun=cl2,
+          cex.legend=0.8,cex.lab=1,
+          cex.axis=0.9,grid=FALSE)
>
> # use different colors
> require(RColorBrewer)
Loading required package: RColorBrewer
> col.cage= brewer.pal(9,"Blues")
> col.cpgi= brewer.pal(9,"YlGn")
> multiHeatMatrix(sml,
+                  clustfun=function(x) kmeans(x, centers=2)$cluster,
+                  cex.axis=0.8,xcoords=c(-1000,1000),
+                  winsorize=c(0,99),col=list(col.cage,col.cpgi),
+                  legend.name=c("tpm","coverage"),xlab="region around TSS")
> ## End(No test)
>
>
>
>
>
> dev.off()
null device
          1
>
 .
.