R: Plot annotation categories from AnnotationByGeneParts or...
plotTargetAnnotation
R Documentation
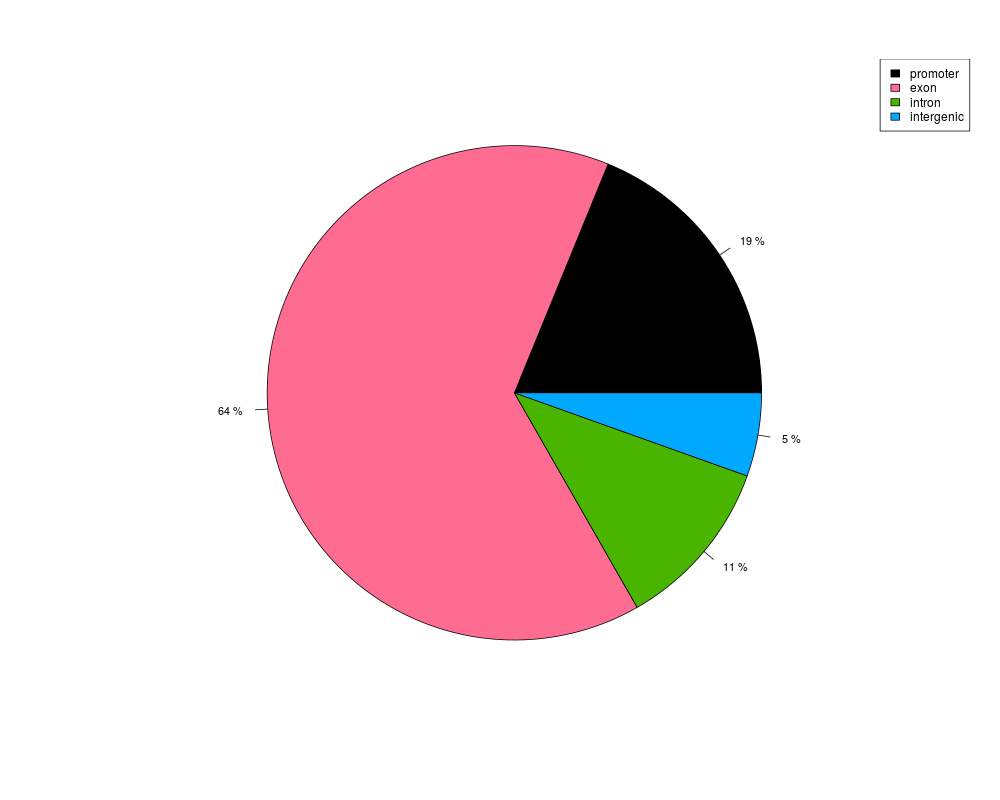
Plot annotation categories from AnnotationByGeneParts or AnnotationByFeature
Description
This function plots a pie or bar chart for showing percentages of targets
annotated by genic parts or other query features
Usage
plotTargetAnnotation(x, precedence = TRUE,
  col = getColors(length(x@annotation)), cex.legend = 1, ...)

## S4 method for signature 'AnnotationByFeature'
plotTargetAnnotation(x, precedence = TRUE,
  col = getColors(length(x@annotation)), cex.legend = 1, ...)
Arguments
x
a AnnotationByFeature or
AnnotationByGeneParts object
precedence
TRUE|FALSE. If TRUE there will be a hierachy of annotation
features when calculating numbers
(with promoter>exon>intron precedence).
This option is only valid when x is a
AnnotationByGeneParts object
col
a vector of colors for piechart or the bar plot
cex.legend
a numeric value of length 1 to specify the size of the legend. By default 1.
...
graphical parameters to be passed to pie
or barplot functions
Value
plots a piechart or a barplot for percentage of
the target features overlapping with annotation
R version 3.3.1 (2016-06-21) -- "Bug in Your Hair"
Copyright (C) 2016 The R Foundation for Statistical Computing
Platform: x86_64-pc-linux-gnu (64-bit)

R is free software and comes with ABSOLUTELY NO WARRANTY.
You are welcome to redistribute it under certain conditions.
Type 'license()' or 'licence()' for distribution details.

R is a collaborative project with many contributors.
Type 'contributors()' for more information and
'citation()' on how to cite R or R packages in publications.

Type 'demo()' for some demos, 'help()' for on-line help, or
'help.start()' for an HTML browser interface to help.
Type 'q()' to quit R.

> library(genomation)
Loading required package: grid
> png(filename="/home/ddbj/snapshot/RGM3/R_BC/result/genomation/plotTargetAnnotation-methods.Rd_%03d_medium.png", width=480, height=480)
> ### Name: plotTargetAnnotation
> ### Title: Plot annotation categories from AnnotationByGeneParts or
> ###   AnnotationByFeature
> ### Aliases: plotTargetAnnotation
> ###   plotTargetAnnotation,AnnotationByFeature-method
>
> ### ** Examples
>
> data(cage)
>
> bed.file = system.file("extdata/chr21.refseq.hg19.bed", package = "genomation")
> gene.parts = readTranscriptFeatures(bed.file)
Reading the table...
Calculating intron coordinates...
Calculating exon coordinates...
Calculating TSS coordinates...
Calculating promoter coordinates...
Outputting the final GRangesList...

> annot = annotateWithGeneParts(cage, gene.parts, intersect.chr=TRUE)
intersecting chromosomes...
> ## No test:
> plotTargetAnnotation(annot)
> ## End(No test)
>
>
>
>
>
> dev.off()
null device
          1
>
 .
.