Plot location data and chromosome boundaries from a GenoSet or GRanges object
against data from a numeric or Rle. Specifying a chromosome name and optionally a 'xlim'
will zoom into one chromosome region. If more than one chromosome is present, the
chromosome boundaries will be marked. Alternatively, for a numeric x and a
numeric or Rle y, data in y can be plotted at genome positions x. In this case,
chromosome boundaries can be taken from the argument locs. If data for y-axis comes
from a Rle lines are plotted representing segments. X-axis tickmarks will be labeled
with genome positions in the most appropriate units.
Usage
genoPlot(x, y, ...)

## S4 method for signature 'numeric,numeric'
genoPlot(x, y, add = FALSE, xlab = "",
  ylab = "", col = "black", locs = NULL, ...)

## S4 method for signature 'numeric,Rle'
genoPlot(x, y, add = FALSE, xlab = "", ylab = "",
  col = "red", locs = NULL, lwd = 2, xlim = NULL, ...)

## S4 method for signature 'GenoSetOrGenomicRanges,ANY'
genoPlot(x, y, chr = NULL,
  add = FALSE, pch = ".", xlab = "", ylab = "", ...)
Arguments
x
GenoSet (or descendant) or GRanges
y
numeric or Rle
...
Additional plotting args
add
Add plot to existing plot
xlab
character, label for x-axis of plot
ylab
character, label for y-axis of plot
col
character, color to plot lines or points
locs
GRanges, like rowRanges slot of GenoSet
lwd
numeric, line width for segment plots from an Rle
xlim
integer, length two, bounds for genome positions. Used in conjunction with "chr" to subset data for plotting.
chr
Chromosome to plot, NULL by default for full genome
pch
character or numeric, printing character, see points
Value
TRUE
Methods
signature(x = "GenoSetOrGenomicRanges", y = "ANY")
Plot feature locations and data from one sample.
signature(x = "numeric", y = "numeric")
Plot numeric location and a vector of numeric data.
signature(x = "numeric", y = "Rle")
Plot numeric location and a vector of Rle data. Uses lines for Rle runs.
See Also
Other "genome plots": genomeAxis
Examples
data(genoset,package="genoset")
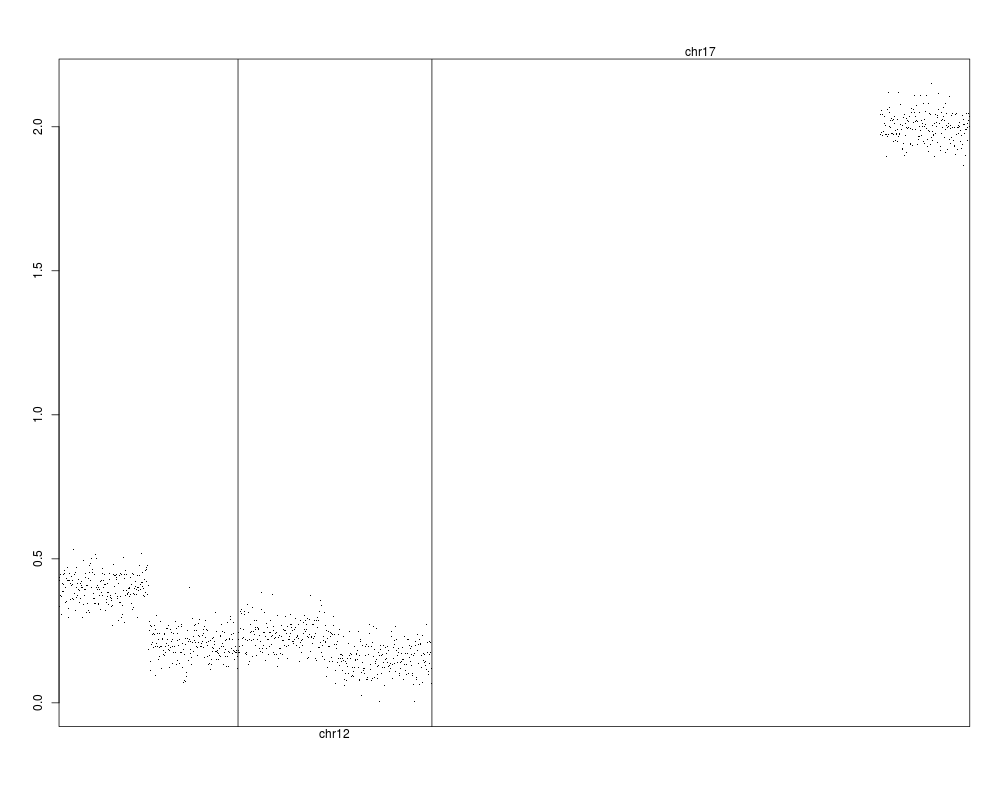
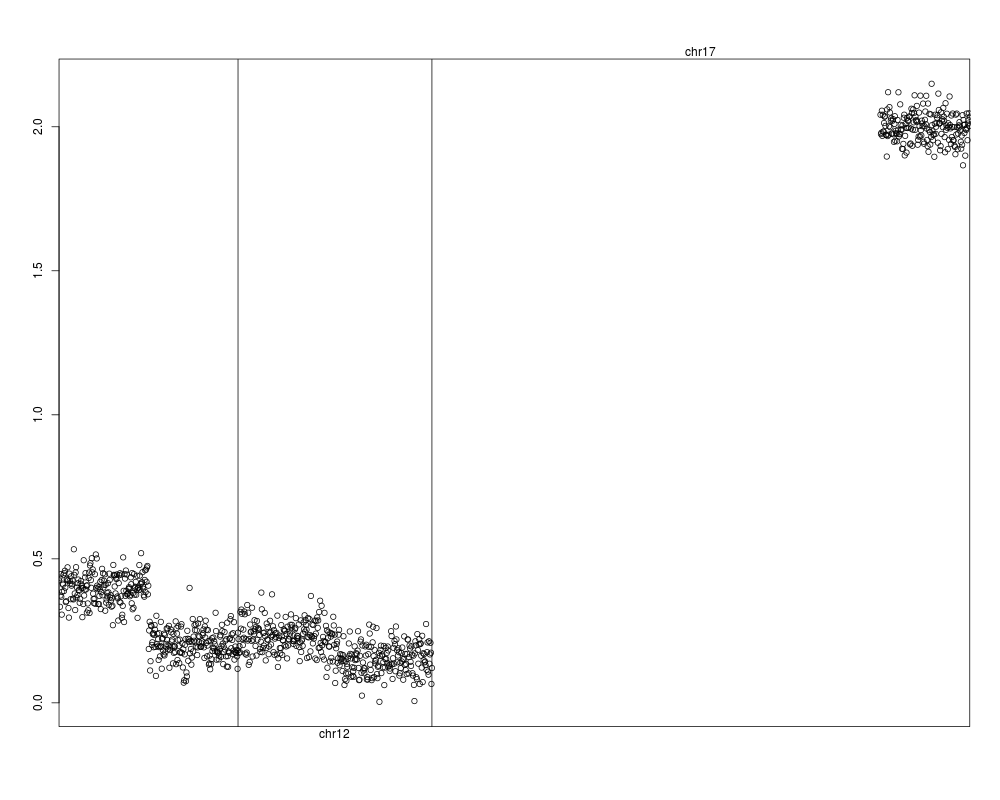
genoPlot( x=genoset.ds,y=genoset.ds[,1,"lrr"] )
genoPlot( genoPos(genoset.ds), genoset.ds[,1,"lrr"], locs=rowRanges(genoset.ds) ) # The same
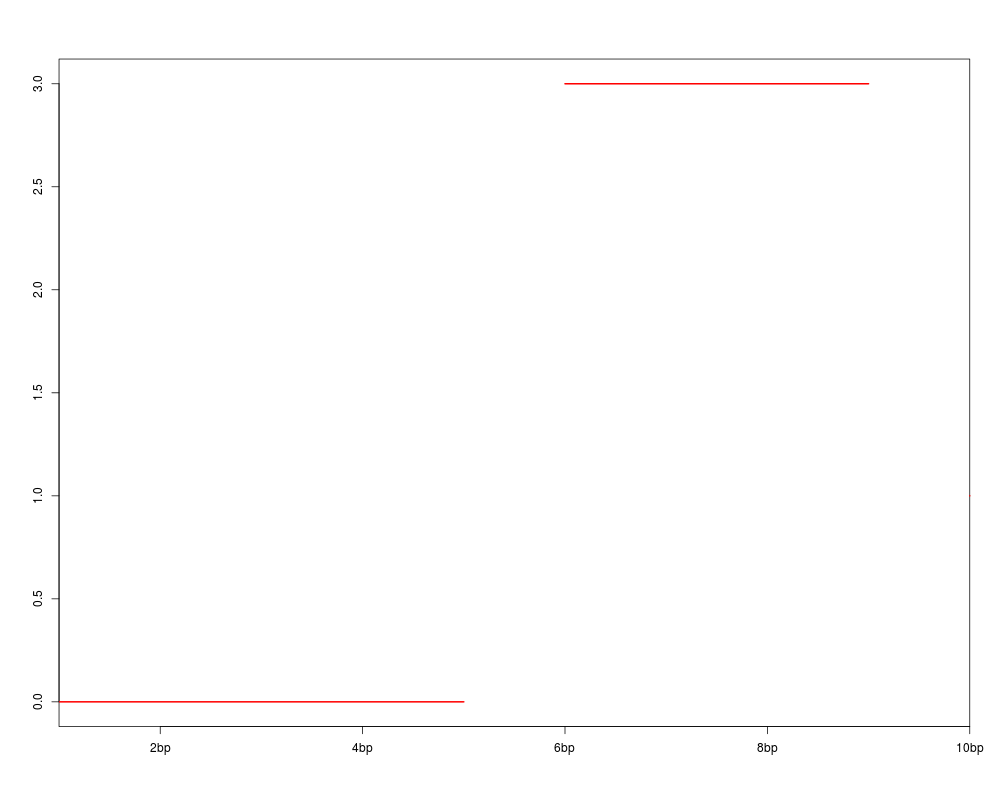
genoPlot( 1:10, Rle(c(rep(0,5),rep(3,4),rep(1,1))) )
Results
R version 3.3.1 (2016-06-21) -- "Bug in Your Hair"
Copyright (C) 2016 The R Foundation for Statistical Computing
Platform: x86_64-pc-linux-gnu (64-bit)

R is free software and comes with ABSOLUTELY NO WARRANTY.
You are welcome to redistribute it under certain conditions.
Type 'license()' or 'licence()' for distribution details.

R is a collaborative project with many contributors.
Type 'contributors()' for more information and
'citation()' on how to cite R or R packages in publications.

Type 'demo()' for some demos, 'help()' for on-line help, or
'help.start()' for an HTML browser interface to help.
Type 'q()' to quit R.

> library(genoset)
Loading required package: BiocGenerics
Loading required package: parallel

Attaching package: 'BiocGenerics'

The following objects are masked from 'package:parallel':

    clusterApply, clusterApplyLB, clusterCall, clusterEvalQ,
    clusterExport, clusterMap, parApply, parCapply, parLapply,
    parLapplyLB, parRapply, parSapply, parSapplyLB

The following objects are masked from 'package:stats':

    IQR, mad, xtabs

The following objects are masked from 'package:base':

    Filter, Find, Map, Position, Reduce, anyDuplicated, append,
    as.data.frame, cbind, colnames, do.call, duplicated, eval, evalq,
    get, grep, grepl, intersect, is.unsorted, lapply, lengths, mapply,
    match, mget, order, paste, pmax, pmax.int, pmin, pmin.int, rank,
    rbind, rownames, sapply, setdiff, sort, table, tapply, union,
    unique, unsplit

Loading required package: GenomicRanges
Loading required package: S4Vectors
Loading required package: stats4

Attaching package: 'S4Vectors'

The following objects are masked from 'package:base':

    colMeans, colSums, expand.grid, rowMeans, rowSums

Loading required package: IRanges
Loading required package: GenomeInfoDb
Loading required package: SummarizedExperiment
Loading required package: Biobase
Welcome to Bioconductor

    Vignettes contain introductory material; view with
    'browseVignettes()'. To cite Bioconductor, see
    'citation("Biobase")', and for packages 'citation("pkgname")'.


*** Genoset API Changes ***
The genoset class has transitioned to the
RangedSummarizedExperiment API from the eSet API (e.g. use colnames instead of sampleNames). ***

Attaching package: 'genoset'

The following object is masked from 'package:GenomicRanges':

    pos

The following objects are masked from 'package:S4Vectors':

    colMeans, colSums, rowMeans, rowSums

The following objects are masked from 'package:base':

    colMeans, colSums, rowMeans, rowSums

Warning messages:
1: multiple methods tables found for 'colMeans'
2: multiple methods tables found for 'colSums'
3: multiple methods tables found for 'rowMeans'
4: multiple methods tables found for 'rowSums'
> png(filename="/home/ddbj/snapshot/RGM3/R_BC/result/genoset/genoPlot-methods.Rd_%03d_medium.png", width=480, height=480)
> ### Name: genoPlot
> ### Title: Plot data along the genome
> ### Aliases: genoPlot genoPlot,GenoSetOrGenomicRanges,ANY-method
> ###   genoPlot,numeric,Rle-method genoPlot,numeric,numeric-method
>
> ### ** Examples
>
> data(genoset,package="genoset")
> genoPlot( x=genoset.ds,y=genoset.ds[,1,"lrr"] )
> genoPlot( genoPos(genoset.ds), genoset.ds[,1,"lrr"], locs=rowRanges(genoset.ds) ) # The same
> genoPlot( 1:10, Rle(c(rep(0,5),rep(3,4),rep(1,1))) )
>
>
>
>
>
> dev.off()
null device
          1
>
 .
.