Supported by Dr. Osamu Ogasawara and  . . |
|
Last data update: 2014.03.03 |
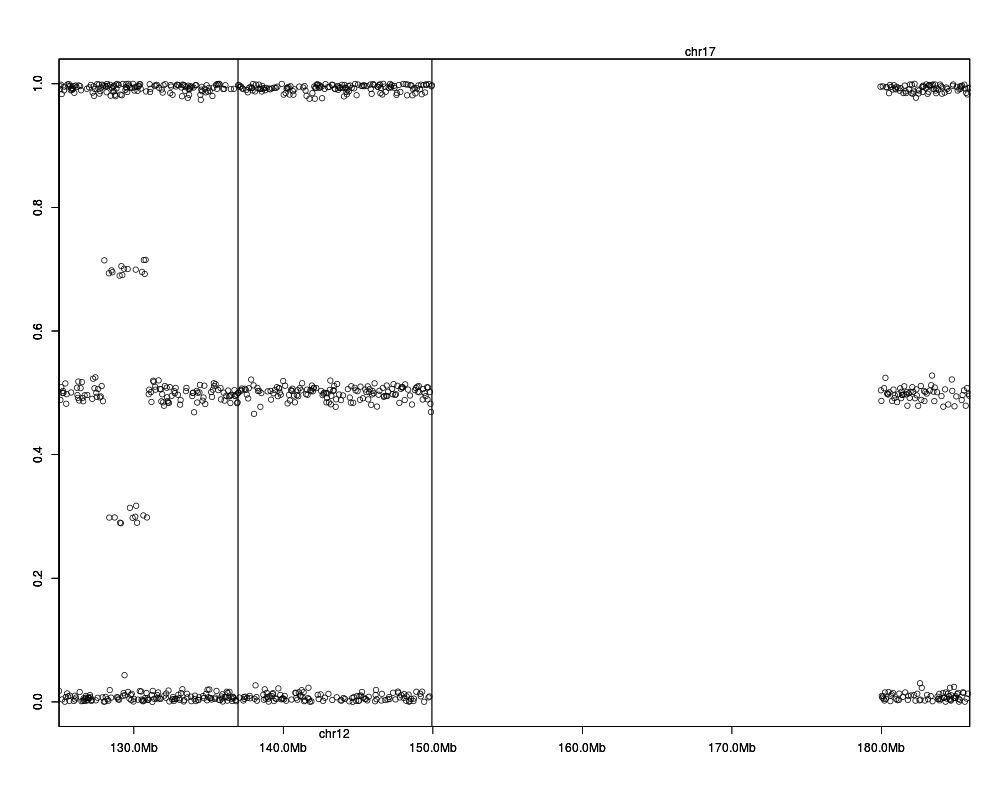
Label axis with base pair unitsDescriptionLabel an axis with base positions UsagegenomeAxis(locs = NULL, side = 1, log = FALSE, do.other.side = TRUE) Arguments
DetailsLabel a plot with Mb, kb, bp as appropriate, using tick locations from axTicks Valuenothing See AlsoOther "genome plots": Examplesdata(genoset,package="genoset") genoPlot(genoPos(genoset.ds), genoset.ds[,1, "baf"]) genomeAxis( locs=rowRanges(genoset.ds) ) # Add chromosome names and boundaries to a plot assuming genome along x-axis genomeAxis( locs=rowRanges(genoset.ds), do.other.side=FALSE ) # As above, but do not label y-axis with data values at tickmarks genomeAxis() # Add nucleotide position in sensible units assuming genome along x-axis Results
R version 3.3.1 (2016-06-21) -- "Bug in Your Hair"
Copyright (C) 2016 The R Foundation for Statistical Computing
Platform: x86_64-pc-linux-gnu (64-bit)

R is free software and comes with ABSOLUTELY NO WARRANTY.
You are welcome to redistribute it under certain conditions.
Type 'license()' or 'licence()' for distribution details.

R is a collaborative project with many contributors.
Type 'contributors()' for more information and
'citation()' on how to cite R or R packages in publications.

Type 'demo()' for some demos, 'help()' for on-line help, or
'help.start()' for an HTML browser interface to help.
Type 'q()' to quit R.

> library(genoset)
Loading required package: BiocGenerics
Loading required package: parallel

Attaching package: 'BiocGenerics'

The following objects are masked from 'package:parallel':

    clusterApply, clusterApplyLB, clusterCall, clusterEvalQ,
    clusterExport, clusterMap, parApply, parCapply, parLapply,
    parLapplyLB, parRapply, parSapply, parSapplyLB

The following objects are masked from 'package:stats':

    IQR, mad, xtabs

The following objects are masked from 'package:base':

    Filter, Find, Map, Position, Reduce, anyDuplicated, append,
    as.data.frame, cbind, colnames, do.call, duplicated, eval, evalq,
    get, grep, grepl, intersect, is.unsorted, lapply, lengths, mapply,
    match, mget, order, paste, pmax, pmax.int, pmin, pmin.int, rank,
    rbind, rownames, sapply, setdiff, sort, table, tapply, union,
    unique, unsplit

Loading required package: GenomicRanges
Loading required package: S4Vectors
Loading required package: stats4

Attaching package: 'S4Vectors'

The following objects are masked from 'package:base':

    colMeans, colSums, expand.grid, rowMeans, rowSums

Loading required package: IRanges
Loading required package: GenomeInfoDb
Loading required package: SummarizedExperiment
Loading required package: Biobase
Welcome to Bioconductor

    Vignettes contain introductory material; view with
    'browseVignettes()'. To cite Bioconductor, see
    'citation("Biobase")', and for packages 'citation("pkgname")'.


*** Genoset API Changes ***
The genoset class has transitioned to the
RangedSummarizedExperiment API from the eSet API (e.g. use colnames instead of sampleNames). ***

Attaching package: 'genoset'

The following object is masked from 'package:GenomicRanges':

    pos

The following objects are masked from 'package:S4Vectors':

    colMeans, colSums, rowMeans, rowSums

The following objects are masked from 'package:base':

    colMeans, colSums, rowMeans, rowSums

Warning messages:
1: multiple methods tables found for 'colMeans'
2: multiple methods tables found for 'colSums'
3: multiple methods tables found for 'rowMeans'
4: multiple methods tables found for 'rowSums'
> png(filename="/home/ddbj/snapshot/RGM3/R_BC/result/genoset/genomeAxis.Rd_%03d_medium.png", width=480, height=480)
> ### Name: genomeAxis
> ### Title: Label axis with base pair units
> ### Aliases: genomeAxis
>
> ### ** Examples
>
>   data(genoset,package="genoset")
>   genoPlot(genoPos(genoset.ds), genoset.ds[,1, "baf"])
>   genomeAxis( locs=rowRanges(genoset.ds) )  # Add chromosome names and boundaries to a plot assuming genome along x-axis
>   genomeAxis( locs=rowRanges(genoset.ds), do.other.side=FALSE ) # As above, but do not label y-axis with data values at tickmarks
>   genomeAxis()           # Add nucleotide position in sensible units assuming genome along x-axis
>
>
>
>
>
> dev.off()
null device
          1
>
|
Created & Maintained by Osamu Ogasawara (osamu.ogasawara@gmail.com) and 