Supported by Dr. Osamu Ogasawara and  . . |
|
Last data update: 2014.03.03 |
Visualizing GWAS resultsDescriptionThis procedure plots the results obtained using runGenphenSnp or runGenphenSaap. UsageplotGenphenResults(genphen.results) Arguments
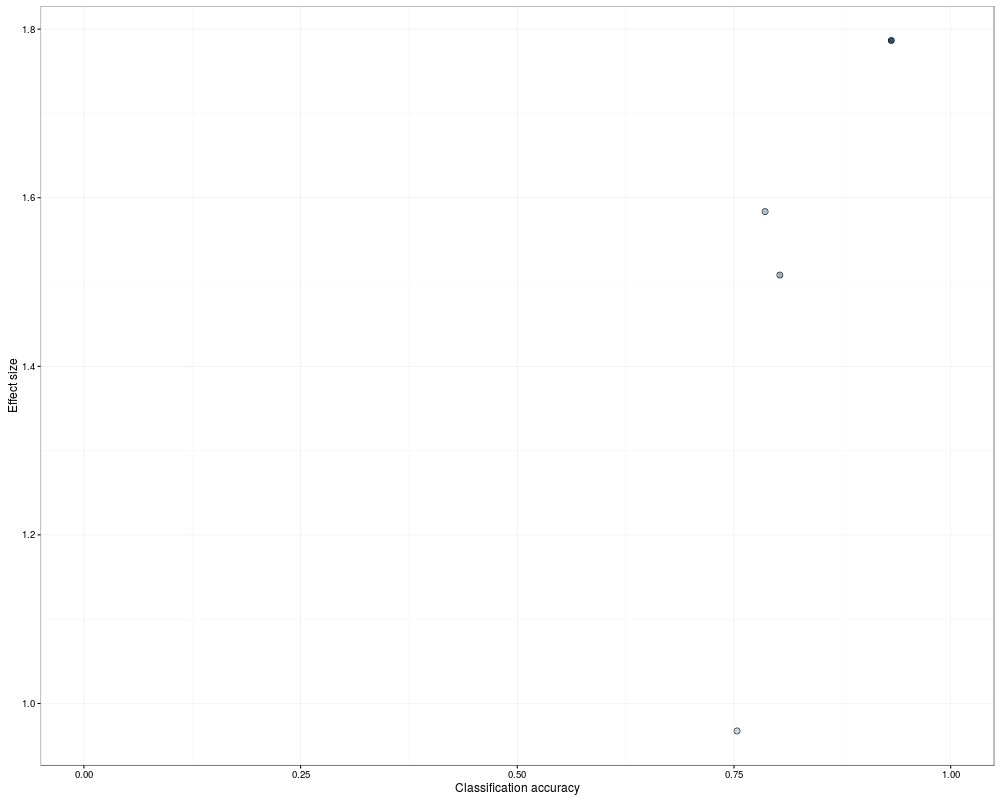
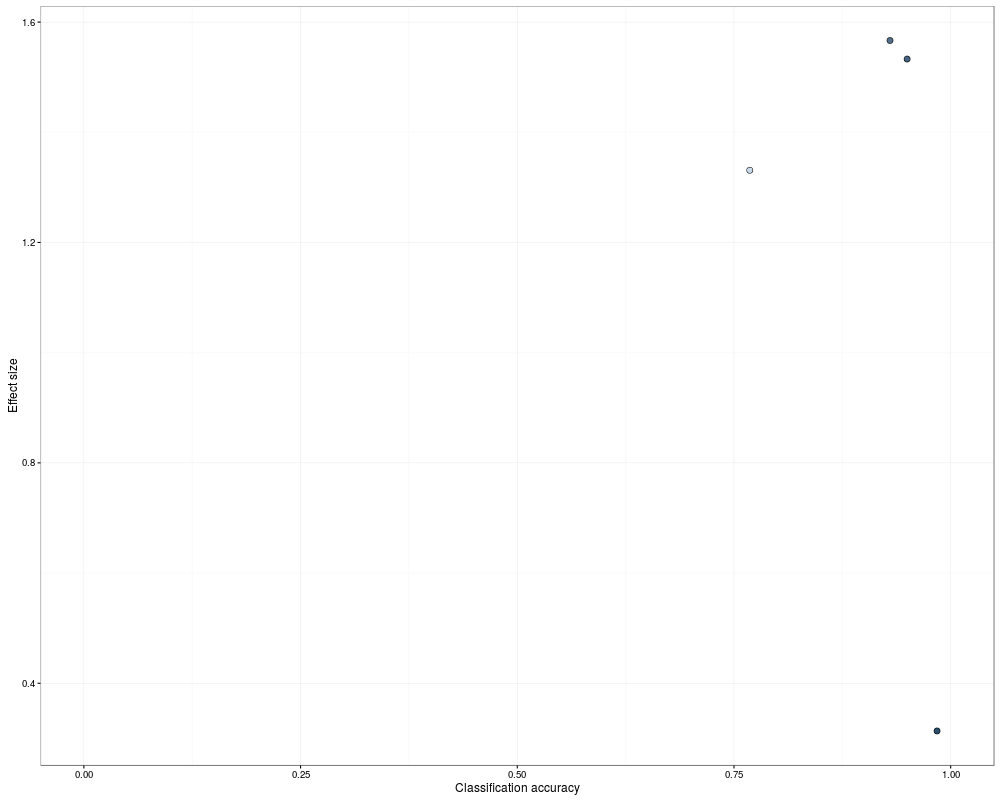
DetailsThis procedure plots the results obtained using runGenphenSnp or runGenphenSaap. Each result entry is plotted as a point with respect to its effect size and classification accuracy attributes, whereby the color of the points is directly proportional to the classification accuracy. The region in the top-right corner of the plot is where the genotypes which have the strongest association with the phenotype are found. Value
Author(s)Simo Kitanovski <simo.kitanovski@uni-due.de> See AlsorunGenphenSaap, runGenphenSnp, plotGenphenResults, plotSpecificGenotype Examples#Example 1: data(genotype.snp) #or data(genotype.snp.msa) in this case you cannot subset genotype.snp[, 1:5] data(phenotype.snp) genphen.results <- runGenphenSnp(genotype = genotype.snp[, 1:5], phenotype = phenotype.snp, technique = "svm", fold.cv = 0.66, boots = 100) genphen.plot <- plotGenphenResults(genphen.results = genphen.results) #Example 2: data(genotype.saap) #or data(genotype.saap.msa) in this case you cannot subset genotype.saap[, 1:5] data(phenotype.saap) genphen.results <- runGenphenSaap(genotype = genotype.saap[, 1:5], phenotype = phenotype.saap, technique = "svm", fold.cv = 0.66, boots = 100) genphen.plot <- plotGenphenResults(genphen.results = genphen.results) Results
R version 3.3.1 (2016-06-21) -- "Bug in Your Hair"
Copyright (C) 2016 The R Foundation for Statistical Computing
Platform: x86_64-pc-linux-gnu (64-bit)

R is free software and comes with ABSOLUTELY NO WARRANTY.
You are welcome to redistribute it under certain conditions.
Type 'license()' or 'licence()' for distribution details.

R is a collaborative project with many contributors.
Type 'contributors()' for more information and
'citation()' on how to cite R or R packages in publications.

Type 'demo()' for some demos, 'help()' for on-line help, or
'help.start()' for an HTML browser interface to help.
Type 'q()' to quit R.

> library(genphen)
Loading required package: randomForest
randomForest 4.6-12
Type rfNews() to see new features/changes/bug fixes.
Loading required package: e1071
Loading required package: ggplot2

Attaching package: 'ggplot2'

The following object is masked from 'package:randomForest':

    margin

Loading required package: effsize
Loading required package: Biostrings
Loading required package: BiocGenerics
Loading required package: parallel

Attaching package: 'BiocGenerics'

The following objects are masked from 'package:parallel':

    clusterApply, clusterApplyLB, clusterCall, clusterEvalQ,
    clusterExport, clusterMap, parApply, parCapply, parLapply,
    parLapplyLB, parRapply, parSapply, parSapplyLB

The following object is masked from 'package:randomForest':

    combine

The following objects are masked from 'package:stats':

    IQR, mad, xtabs

The following objects are masked from 'package:base':

    Filter, Find, Map, Position, Reduce, anyDuplicated, append,
    as.data.frame, cbind, colnames, do.call, duplicated, eval, evalq,
    get, grep, grepl, intersect, is.unsorted, lapply, lengths, mapply,
    match, mget, order, paste, pmax, pmax.int, pmin, pmin.int, rank,
    rbind, rownames, sapply, setdiff, sort, table, tapply, union,
    unique, unsplit

Loading required package: S4Vectors
Loading required package: stats4

Attaching package: 'S4Vectors'

The following objects are masked from 'package:base':

    colMeans, colSums, expand.grid, rowMeans, rowSums

Loading required package: IRanges
Loading required package: XVector
> png(filename="/home/ddbj/snapshot/RGM3/R_BC/result/genphen/plotGenphenResults.Rd_%03d_medium.png", width=480, height=480)
> ### Name: plotGenphenResults
> ### Title: Visualizing GWAS results
> ### Aliases: plotGenphenResults
>
> ### ** Examples
>
> #Example 1:
> data(genotype.snp)
> #or data(genotype.snp.msa) in this case you cannot subset genotype.snp[, 1:5]
> data(phenotype.snp)
> genphen.results <- runGenphenSnp(genotype = genotype.snp[, 1:5],
+ phenotype = phenotype.snp, technique = "svm", fold.cv = 0.66, boots = 100)
> genphen.plot <- plotGenphenResults(genphen.results = genphen.results)
Warning messages:
1: Removed 1 rows containing missing values (geom_point).
2: Removed 1 rows containing missing values (geom_point).
>
> #Example 2:
> data(genotype.saap)
> #or data(genotype.saap.msa) in this case you cannot subset genotype.saap[, 1:5]
> data(phenotype.saap)
> genphen.results <- runGenphenSaap(genotype = genotype.saap[, 1:5],
+ phenotype = phenotype.saap, technique = "svm", fold.cv = 0.66, boots = 100)
> genphen.plot <- plotGenphenResults(genphen.results = genphen.results)
Warning messages:
1: Removed 14 rows containing missing values (geom_point).
2: Removed 14 rows containing missing values (geom_point).
>
>
>
>
>
> dev.off()
null device
          1
>
|
Created & Maintained by Osamu Ogasawara (osamu.ogasawara@gmail.com) and 