Supported by Dr. Osamu Ogasawara and  . . |
|
Last data update: 2014.03.03 |
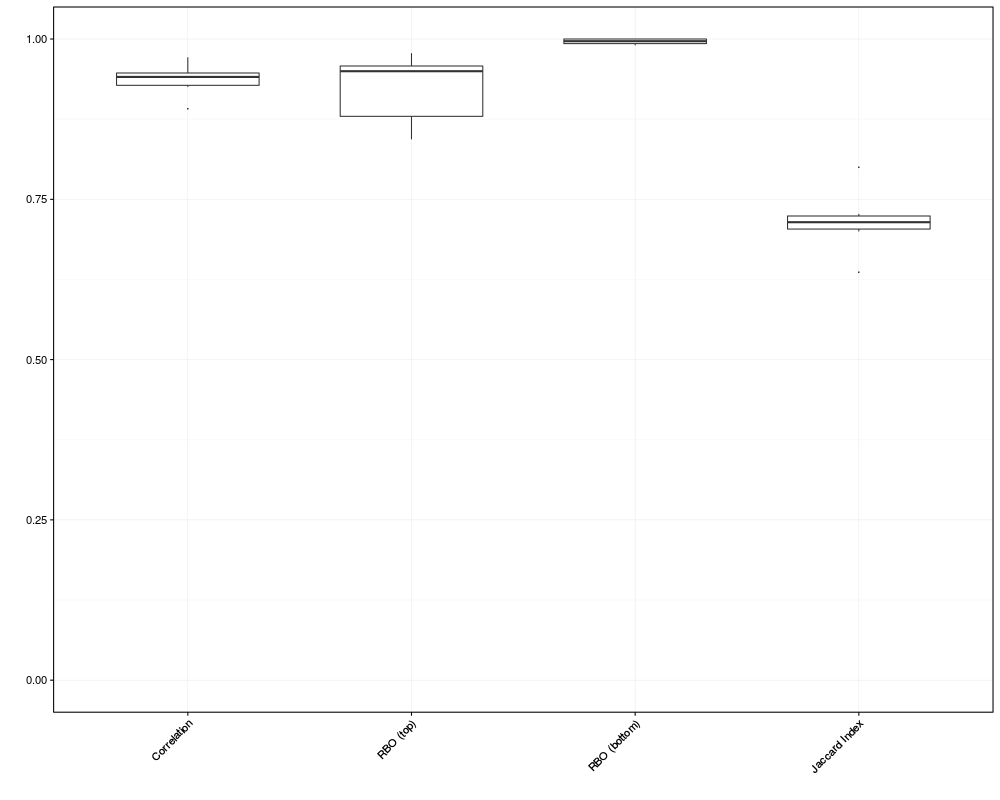
Evaluate the concordance between Phenotype objectsDescriptionMeasures include the correlation (rho) between pairs of phenotypes for the same gene, the rank biased overlap ( Usageconcordance(..., min.overlap = 10, cor.method = "spearman", rbo.p = 0.98, rbo.k = NULL, rbo.mid = 0, uneven.lengths = TRUE) Arguments
ValueA
Author(s)Fabian Schmich See Also
Examplesdata(stabilityfits) conc <- concordance(gsp(stabilityfits$A), gsp(stabilityfits$B), gsp(stabilityfits$C), gsp(stabilityfits$D)) plot(conc) Results
R version 3.3.1 (2016-06-21) -- "Bug in Your Hair"
Copyright (C) 2016 The R Foundation for Statistical Computing
Platform: x86_64-pc-linux-gnu (64-bit)

R is free software and comes with ABSOLUTELY NO WARRANTY.
You are welcome to redistribute it under certain conditions.
Type 'license()' or 'licence()' for distribution details.

R is a collaborative project with many contributors.
Type 'contributors()' for more information and
'citation()' on how to cite R or R packages in publications.

Type 'demo()' for some demos, 'help()' for on-line help, or
'help.start()' for an HTML browser interface to help.
Type 'q()' to quit R.

> library(gespeR)
Loading required package: ggplot2
> png(filename="/home/ddbj/snapshot/RGM3/R_BC/result/gespeR/concordance.Rd_%03d_medium.png", width=480, height=480)
> ### Name: concordance
> ### Title: Evaluate the concordance between Phenotype objects
> ### Aliases: concordance
>
> ### ** Examples
>
> data(stabilityfits)
> conc <- concordance(gsp(stabilityfits$A), gsp(stabilityfits$B),
+ gsp(stabilityfits$C), gsp(stabilityfits$D))
> plot(conc)
>
>
>
>
>
> dev.off()
null device
          1
>
|