Supported by Dr. Osamu Ogasawara and  . . |
|
Last data update: 2014.03.03 |
Package: Gene-Specific Phenotype EstimatoRDescriptionThis package provides a model to deconvolute off-target confounded RNAi knockdown phentypes, and methods to investigate concordance between ranked lists of (estimated) phenotypes. The regularized linear regression model can be fitted using two different strategies. (a) Cross-validation over regularization parameters optimising the mean-squared-error of the model and (b) stability selection of covariates (genes) based on a method by Nicolai Meinshausen et al. Author(s)Fabian Schmich | Computational Biology Group, ETH ZURICH | fabian.schmich@bsse.ethz.ch ReferencesFabian Schmich et. al, Deconvoluting Off-Target Confounded RNA Interference Screens (2014). See Also
Examples
# Read phenotypes
phenos <- lapply(LETTERS[1:4], function(x) {
sprintf("Phenotypes_screen_%s.txt", x)
})
phenos <- lapply(phenos, function(x) {
Phenotypes(system.file("extdata", x, package="gespeR"),
type = "SSP",
col.id = 1,
col.score = 2)
})
phenos
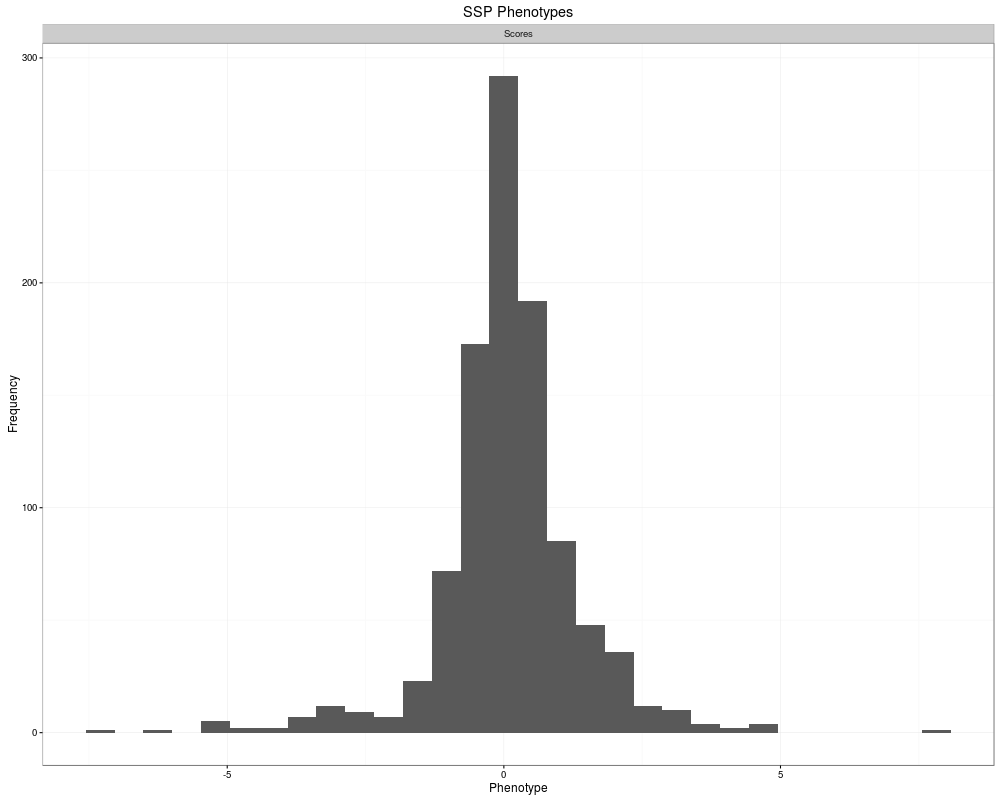
plot(phenos[[1]])
# Read target relations
tr <- lapply(LETTERS[1:4], function(x) {
sprintf("TR_screen_%s.rds", x)
})
tr <- lapply(tr, function(x) {
TargetRelations(system.file("extdata", x, package="gespeR"))
})
tr[[1]]
tempfile <- paste(tempfile(pattern = "file", tmpdir = tempdir()), ".rds", sep="")
tr[[1]] <- unloadValues(tr[[1]], writeValues = TRUE, path = tempfile)
tr[[1]]
tr[[1]] <- loadValues(tr[[1]])
tr[[1]]
# Fit gespeR models with cross validation
res.cv <- lapply(1:length(phenos), function(i) {
gespeR(phenotypes = phenos[[i]],
target.relations = tr[[i]],
mode = "cv",
alpha = 0.5,
ncores = 1)
})
summary(res.cv[[1]])
res.cv[[1]]
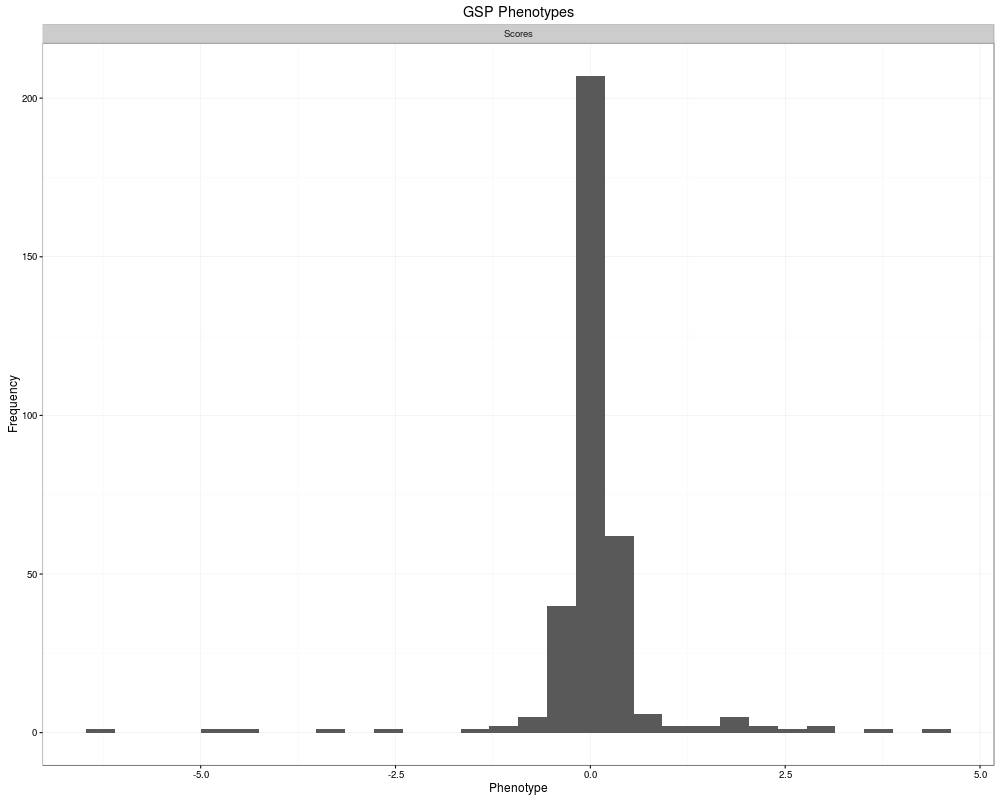
plot(res.cv[[1]])
# Extract scores
ssp(res.cv[[1]])
gsp(res.cv[[1]])
head(scores(res.cv[[1]]))
# Fit gespeR models with stability selection
res.stab <- lapply(1:length(phenos), function(i) {
gespeR(phenotypes = phenos[[i]],
target.relations = tr[[i]],
mode = "stability",
nbootstrap = 100,
fraction = 0.67,
threshold = 0.75,
EV = 1,
weakness = 0.8,
ncores = 1)
})
summary(res.stab[[1]])
res.stab[[1]]
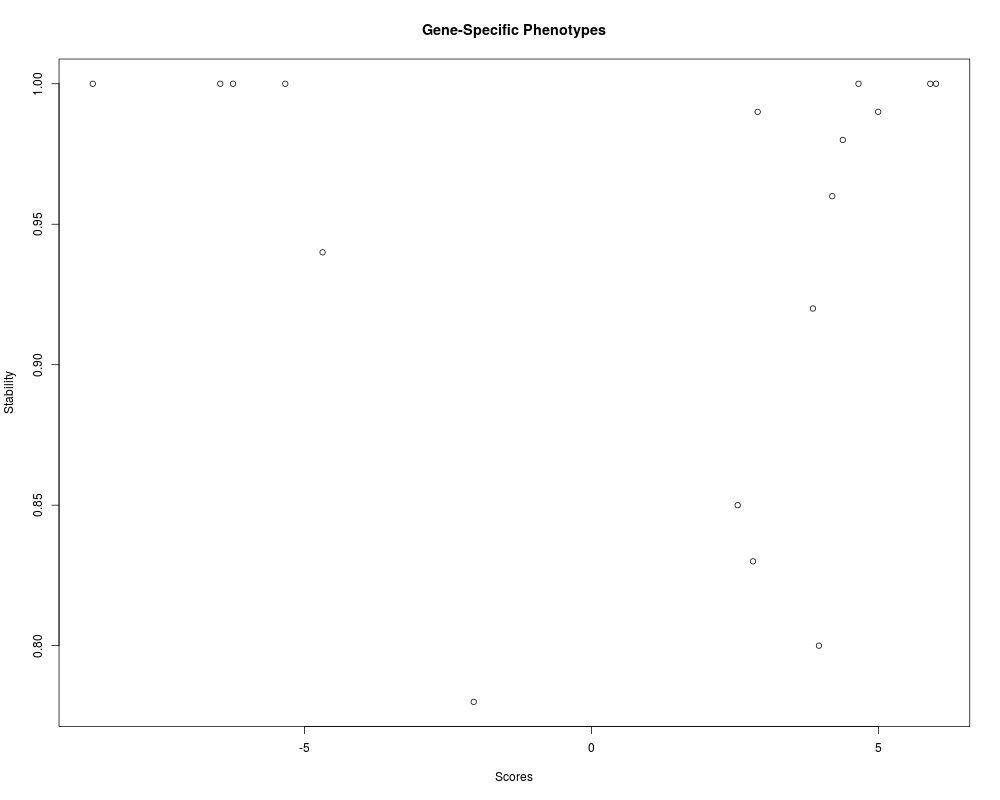
plot(res.stab[[1]])
# Extract scores
ssp(res.stab[[1]])
gsp(res.stab[[1]])
head(scores(res.stab[[1]]))
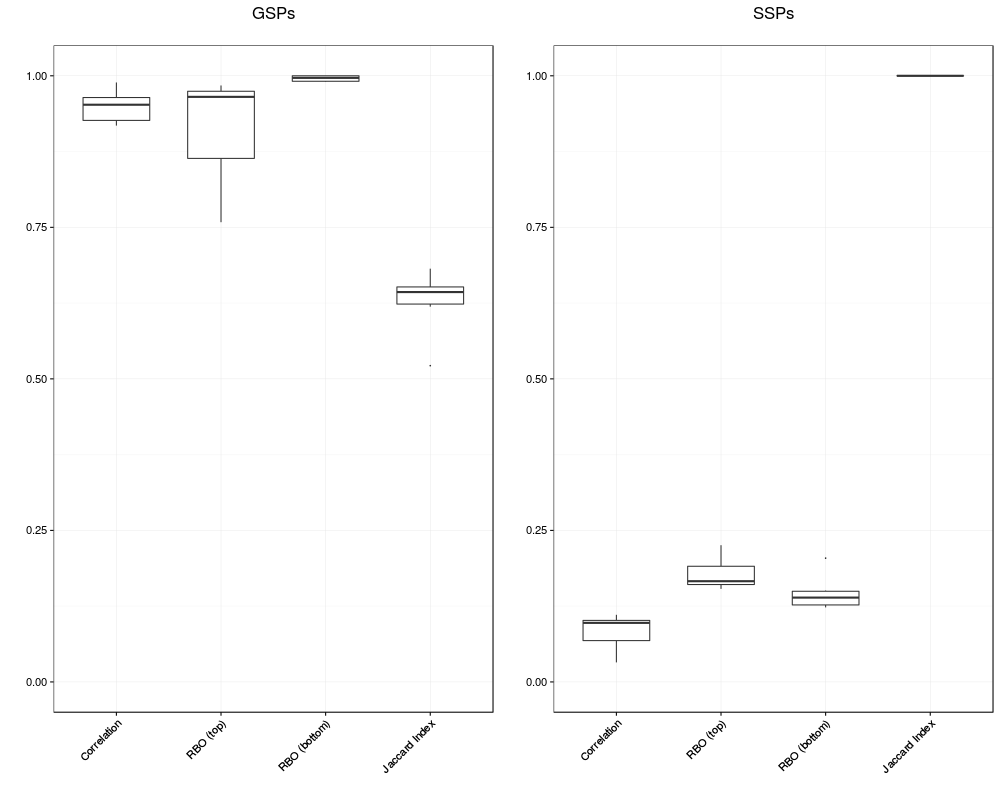
# Compare concordance between stability selected GSPs and SSPs
conc.gsp <- concordance(lapply(res.stab, gsp))
conc.ssp <- concordance(lapply(res.stab, ssp))
pl.gsp <- plot(conc.gsp) + ggtitle("GSPs\n")
pl.ssp <- plot(conc.ssp) + ggtitle("SSPs\n")
if (require(grid)) {
grid.newpage()
pushViewport(viewport(layout = grid.layout(1, 2) ) )
print(pl.gsp, vp = viewport(layout.pos.row = 1, layout.pos.col = 1))
print(pl.ssp, vp = viewport(layout.pos.row = 1, layout.pos.col = 2))
} else {
plot(pl.gsp)
plot(pl.ssp)
}
Results
R version 3.3.1 (2016-06-21) -- "Bug in Your Hair"
Copyright (C) 2016 The R Foundation for Statistical Computing
Platform: x86_64-pc-linux-gnu (64-bit)

R is free software and comes with ABSOLUTELY NO WARRANTY.
You are welcome to redistribute it under certain conditions.
Type 'license()' or 'licence()' for distribution details.

R is a collaborative project with many contributors.
Type 'contributors()' for more information and
'citation()' on how to cite R or R packages in publications.

Type 'demo()' for some demos, 'help()' for on-line help, or
'help.start()' for an HTML browser interface to help.
Type 'q()' to quit R.

> library(gespeR)
Loading required package: ggplot2
> png(filename="/home/ddbj/snapshot/RGM3/R_BC/result/gespeR/gespeR-package.Rd_%03d_medium.png", width=480, height=480)
> ### Name: gespeR-package
> ### Title: Package: Gene-Specific Phenotype EstimatoR
> ### Aliases: gespeR-package gespeRpkg
> ### Keywords: package
>
> ### ** Examples
>
> # Read phenotypes
> phenos <- lapply(LETTERS[1:4], function(x) {
+   sprintf("Phenotypes_screen_%s.txt", x)
+   })
> phenos <- lapply(phenos, function(x) {
+   Phenotypes(system.file("extdata", x, package="gespeR"),
+              type = "SSP",
+              col.id = 1,
+              col.score = 2)
+ })
> phenos
[[1]]
1000 SSP Phenotypes

Source: local data frame [1,000 x 2]

             ID      Scores
         <fctr>       <dbl>
1  siRNAID_0001 -0.93028719
2  siRNAID_0002 -1.12820384
3  siRNAID_0003 -1.05265043
4  siRNAID_0004  0.80792721
5  siRNAID_0005 -1.41533349
6  siRNAID_0006  1.64265769
7  siRNAID_0007 -0.15733945
8  siRNAID_0008  0.74758974
9  siRNAID_0009 -0.95904664
10 siRNAID_0010 -0.04401824
..          ...         ...

[[2]]
1000 SSP Phenotypes

Source: local data frame [1,000 x 2]

             ID      Scores
         <fctr>       <dbl>
1  siRNAID_0001 -0.03449127
2  siRNAID_0002 -1.20204172
3  siRNAID_0003  0.61928972
4  siRNAID_0004  0.73851086
5  siRNAID_0005 -1.05208103
6  siRNAID_0006 -1.89923289
7  siRNAID_0007 -0.80147312
8  siRNAID_0008 -0.80793694
9  siRNAID_0009 -0.48951972
10 siRNAID_0010  2.29451953
..          ...         ...

[[3]]
1000 SSP Phenotypes

Source: local data frame [1,000 x 2]

             ID     Scores
         <fctr>      <dbl>
1  siRNAID_0001 -0.7699427
2  siRNAID_0002  0.1639373
3  siRNAID_0003  0.8552572
4  siRNAID_0004  1.5533076
5  siRNAID_0005 -1.0568078
6  siRNAID_0006 -0.3936947
7  siRNAID_0007 -0.3098966
8  siRNAID_0008 -0.9935065
9  siRNAID_0009 -0.7872706
10 siRNAID_0010  0.4272948
..          ...        ...

[[4]]
1000 SSP Phenotypes

Source: local data frame [1,000 x 2]

             ID       Scores
         <fctr>        <dbl>
1  siRNAID_0001  0.726427533
2  siRNAID_0002 -0.671632733
3  siRNAID_0003 -0.005147139
4  siRNAID_0004  1.383430888
5  siRNAID_0005  0.491954863
6  siRNAID_0006  0.330629291
7  siRNAID_0007  2.319440712
8  siRNAID_0008 -2.836728304
9  siRNAID_0009 -0.543384151
10 siRNAID_0010  0.315789048
..          ...          ...

> plot(phenos[[1]])
`stat_bin()` using `bins = 30`. Pick better value with `binwidth`.
>
> # Read target relations
> tr <- lapply(LETTERS[1:4], function(x) {
+   sprintf("TR_screen_%s.rds", x)
+ })
> tr <- lapply(tr, function(x) {
+   TargetRelations(system.file("extdata", x, package="gespeR"))
+ })
> tr[[1]]
1000 x 1500 siRNA-to-gene relations.
10 x 5 sparse Matrix of class "dgCMatrix"
              colnames
rownames       geneID_0001 geneID_0002 geneID_0003 geneID_0004 geneID_0005
  siRNAID_0001           .           .           .           .           .
  siRNAID_0002           .           .           .           .           .
  siRNAID_0003           .           .           .           .           .
  siRNAID_0004           .           .           .           .           .
  siRNAID_0005           .           .           .           .           .
  siRNAID_0006           .           .           .           .           .
  siRNAID_0007           .           .           .           .           .
  siRNAID_0008           .           .           .           .           .
  siRNAID_0009           .           .           .           .           .
  siRNAID_0010           .           .           .           .           .
...
> tempfile <- paste(tempfile(pattern = "file", tmpdir = tempdir()), ".rds", sep="")
> tr[[1]] <- unloadValues(tr[[1]], writeValues = TRUE, path = tempfile)
> tr[[1]]
Values not loaded: /tmp/RtmpChv6rW/file7b1a6f19cd81.rds
> tr[[1]] <- loadValues(tr[[1]])
> tr[[1]]
1000 x 1500 siRNA-to-gene relations.
10 x 5 sparse Matrix of class "dgCMatrix"
              colnames
rownames       geneID_0001 geneID_0002 geneID_0003 geneID_0004 geneID_0005
  siRNAID_0001           .           .           .           .           .
  siRNAID_0002           .           .           .           .           .
  siRNAID_0003           .           .           .           .           .
  siRNAID_0004           .           .           .           .           .
  siRNAID_0005           .           .           .           .           .
  siRNAID_0006           .           .           .           .           .
  siRNAID_0007           .           .           .           .           .
  siRNAID_0008           .           .           .           .           .
  siRNAID_0009           .           .           .           .           .
  siRNAID_0010           .           .           .           .           .
...
>
> # Fit gespeR models with cross validation
> res.cv <- lapply(1:length(phenos), function(i) {
+   gespeR(phenotypes = phenos[[i]],
+          target.relations = tr[[i]],
+          mode = "cv",
+          alpha = 0.5,
+          ncores = 1)
+ })
> summary(res.cv[[1]])
Length  Class   Mode
     1 gespeR     S4
> res.cv[[1]]
Source: local data frame [1,500 x 2]

            ID   Scores
        <fctr>    <dbl>
1  geneID_0900 4.356215
2  geneID_0569 3.592164
3  geneID_0666 3.089913
4  geneID_0477 2.892258
5  geneID_1158 2.634101
6  geneID_1406 2.389005
7  geneID_0412 2.284040
8  geneID_0442 1.933519
9  geneID_1216 1.894390
10 geneID_1231 1.828290
..         ...      ...
> plot(res.cv[[1]])
`stat_bin()` using `bins = 30`. Pick better value with `binwidth`.
Warning message:
Removed 1156 rows containing non-finite values (stat_bin).
>
> # Extract scores
> ssp(res.cv[[1]])
1000 SSP Phenotypes

Source: local data frame [1,000 x 2]

             ID      Scores
         <fctr>       <dbl>
1  siRNAID_0001 -0.93028719
2  siRNAID_0002 -1.12820384
3  siRNAID_0003 -1.05265043
4  siRNAID_0004  0.80792721
5  siRNAID_0005 -1.41533349
6  siRNAID_0006  1.64265769
7  siRNAID_0007 -0.15733945
8  siRNAID_0008  0.74758974
9  siRNAID_0009 -0.95904664
10 siRNAID_0010 -0.04401824
..          ...         ...
> gsp(res.cv[[1]])
1500 GSP Phenotypes

Source: local data frame [1,500 x 2]

            ID Scores
        <fctr>  <dbl>
1  geneID_0001     NA
2  geneID_0002     NA
3  geneID_0003     NA
4  geneID_0004     NA
5  geneID_0005     NA
6  geneID_0006     NA
7  geneID_0007     NA
8  geneID_0008     NA
9  geneID_0009     NA
10 geneID_0010     NA
..         ...    ...
> head(scores(res.cv[[1]]))
Source: local data frame [6 x 2]

           ID Scores
       <fctr>  <dbl>
1 geneID_0001     NA
2 geneID_0002     NA
3 geneID_0003     NA
4 geneID_0004     NA
5 geneID_0005     NA
6 geneID_0006     NA
>
> # Fit gespeR models with stability selection
> res.stab <- lapply(1:length(phenos), function(i) {
+   gespeR(phenotypes = phenos[[i]],
+          target.relations = tr[[i]],
+          mode = "stability",
+          nbootstrap = 100,
+          fraction = 0.67,
+          threshold = 0.75,
+          EV = 1,
+          weakness = 0.8,
+          ncores = 1)
+ })
> summary(res.stab[[1]])
Length  Class   Mode
     1 gespeR     S4
> res.stab[[1]]
Source: local data frame [1,500 x 3]

            ID    Scores Stability
        <fctr>     <dbl>     <dbl>
1  geneID_0446 -8.684445      1.00
2  geneID_0477  4.615701      1.00
3  geneID_0514 -6.455992      1.00
4  geneID_0666  4.947212      1.00
5  geneID_0728 -6.249060      1.00
6  geneID_0900  6.010351      1.00
7  geneID_0255 -5.310925      0.99
8  geneID_0569  5.902296      0.99
9  geneID_0923 -4.739375      0.99
10 geneID_1216  2.930437      0.99
..         ...       ...       ...
> plot(res.stab[[1]])
>
> # Extract scores
> ssp(res.stab[[1]])
1000 SSP Phenotypes

Source: local data frame [1,000 x 2]

             ID      Scores
         <fctr>       <dbl>
1  siRNAID_0001 -0.93028719
2  siRNAID_0002 -1.12820384
3  siRNAID_0003 -1.05265043
4  siRNAID_0004  0.80792721
5  siRNAID_0005 -1.41533349
6  siRNAID_0006  1.64265769
7  siRNAID_0007 -0.15733945
8  siRNAID_0008  0.74758974
9  siRNAID_0009 -0.95904664
10 siRNAID_0010 -0.04401824
..          ...         ...
> gsp(res.stab[[1]])
1500 GSP Phenotypes

Source: local data frame [1,500 x 2]

            ID Scores
        <fctr>  <dbl>
1  geneID_0001     NA
2  geneID_0002     NA
3  geneID_0003     NA
4  geneID_0004     NA
5  geneID_0005     NA
6  geneID_0006     NA
7  geneID_0007     NA
8  geneID_0008     NA
9  geneID_0009     NA
10 geneID_0010     NA
..         ...    ...
> head(scores(res.stab[[1]]))
Source: local data frame [6 x 2]

           ID Scores
       <fctr>  <dbl>
1 geneID_0001     NA
2 geneID_0002     NA
3 geneID_0003     NA
4 geneID_0004     NA
5 geneID_0005     NA
6 geneID_0006     NA
>
> # Compare concordance between stability selected GSPs and SSPs
> conc.gsp <- concordance(lapply(res.stab, gsp))
> conc.ssp <- concordance(lapply(res.stab, ssp))
>
> pl.gsp <- plot(conc.gsp) + ggtitle("GSPs\n")
> pl.ssp <- plot(conc.ssp) + ggtitle("SSPs\n")
>
> if (require(grid)) {
+   grid.newpage()
+   pushViewport(viewport(layout = grid.layout(1, 2) ) )
+   print(pl.gsp, vp = viewport(layout.pos.row = 1, layout.pos.col = 1))
+   print(pl.ssp, vp = viewport(layout.pos.row = 1, layout.pos.col = 2))
+ } else {
+   plot(pl.gsp)
+   plot(pl.ssp)
+ }
Loading required package: grid
>
>
>
>
>
> dev.off()
null device
          1
>
|
Created & Maintained by Osamu Ogasawara (osamu.ogasawara@gmail.com) and 