Last data update: 2014.03.03
R: Alignment geoms for GRanges object
geom_alignment R Documentation
Alignment geoms for GRanges object
Description
Show interval data as alignment.
Usage
## S4 method for signature 'GRanges'
geom_alignment(data, ..., xlab, ylab, main, facets = NULL, stat =
                 c("stepping", "identity"), range.geom = c("rect",
                 "arrowrect"), gap.geom = c("chevron", "arrow",
                 "segment"), rect.height = NULL, group.selfish = TRUE,
                  label = TRUE)

## S4 method for signature 'TxDbOREnsDb'
geom_alignment(data, ..., which, columns = c("tx_id", "tx_name",
                 "gene_id"), names.expr = "tx_name", facets = NULL,
                 truncate.gaps = FALSE, truncate.fun = NULL, ratio =
                 0.0025)

## S4 method for signature 'GRangesList'
geom_alignment(data, ..., which = NULL,
                          cds.rect.h = 0.25,
                          exon.rect.h = cds.rect.h,
                          utr.rect.h = cds.rect.h/2,
                          xlab, ylab, main,
                          facets = NULL, geom = "alignment",
                          stat = c("identity", "reduce"),
                          range.geom = "rect",
                          gap.geom = "arrow",
                          utr.geom = "rect",
                          names.expr = NULL,
                          label = TRUE,
                          label.color = "gray40",
                          arrow.rate = 0.015,
                          length = unit(0.1, "cm"))

## S4 method for signature 'OrganismDb'
geom_alignment(data, ..., which,
                   columns = c("TXNAME", "SYMBOL", "TXID", "GENEID"),
                   names.expr = "SYMBOL",
                   facets = NULL,
                   truncate.gaps = FALSE,
                   truncate.fun = NULL, ratio = 0.0025
                   )
Arguments
data
A GRanges, data.frame, TxDb or EnsDb object.
...
Extra parameters such as aes() passed.
which
GRanges object to subset the TxDb or EnsDb
object. For EnsDb: can also be a single, or a list of, filter object(s)
extending BasicFilter-class.
cds.rect.h
cds heights.
exon.rect.h
exon heights.
utr.rect.h
utr heights.
label.color
label color.
arrow.rate
arrow rate.
length
arrow length.
columns
columns to get from object.
xlab
Label for x
ylab
Label for y
main
Title for plot.
facets
Faceting formula to use.
stat
For GRanges:
Character vector specifying statistics to use. "stepping" with
randomly assigned stepping levels as y varialbe. "identity" allow
users to specify y value in aes.
For TxDb:
defualt "identity" give full gene model and "reduce" for reduced model.
gap.geom
Geom for 'gap' computed from the data you passed based on the group information.
rect.height
Half height of the arrow body.
group.selfish
Passed to addStepping, control whether to show each group as
unique level or not. If set to FALSE, if two groups are not
overlapped with each other, they will probably be layout in the same
level to save space.
truncate.gaps
logical value indicate to truncate gaps or not.
truncate.fun
shrinkage function. Please see shrinkagefun in package biovizBase.
ratio
used in maxGap.
geom
geometric object. only support "gene" now.
range.geom
geom for main intevals or exons.
utr.geom
geom for utr region.
names.expr
expression for showing y label.
label
logical value. Whether to label the intervals with names specified
by argument names.expr.
Value
A 'Layer'.
Author(s)
Tengfei Yin
Examples
set.seed(1)
N <- 100
require(GenomicRanges)
## ======================================================================
## simmulated GRanges
## ======================================================================
gr <- GRanges(seqnames =
sample(c("chr1", "chr2", "chr3"),
size = N, replace = TRUE),
IRanges(
start = sample(1:300, size = N, replace = TRUE),
width = sample(70:75, size = N,replace = TRUE)),
strand = sample(c("+", "-", "*"), size = N,
replace = TRUE),
value = rnorm(N, 10, 3), score = rnorm(N, 100, 30),
sample = sample(c("Normal", "Tumor"),
size = N, replace = TRUE),
pair = sample(letters, size = N,
replace = TRUE))
## ======================================================================
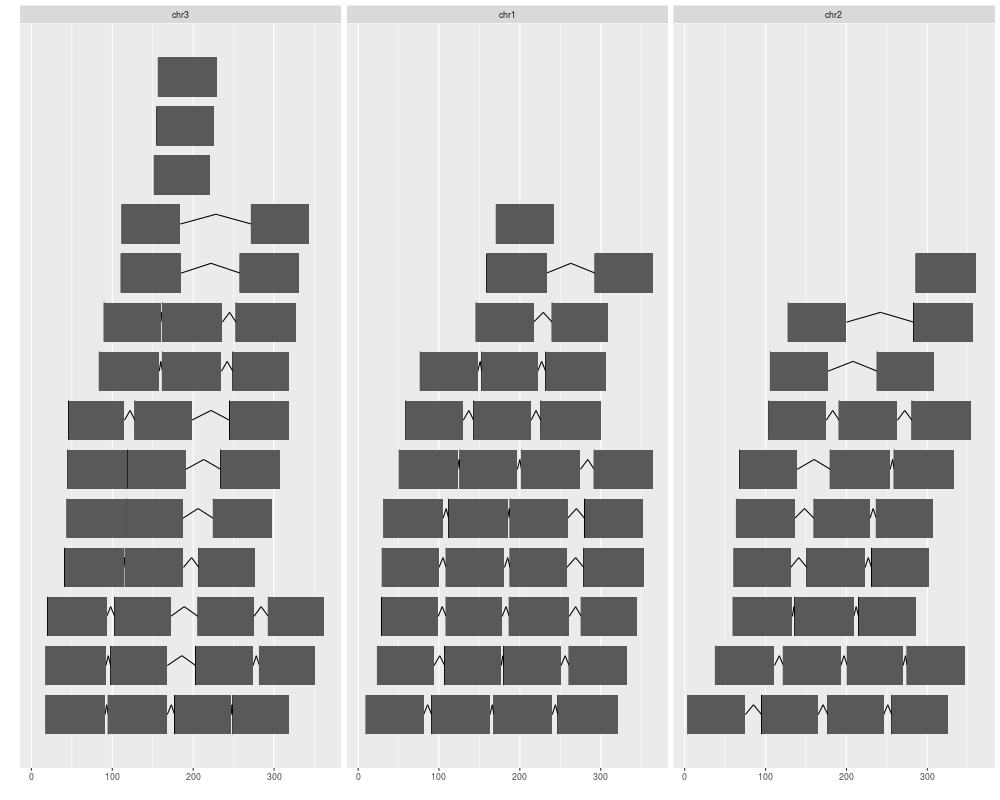
## default
## ======================================================================
ggplot(gr) + geom_alignment()
## or
ggplot() + geom_alignment(gr)
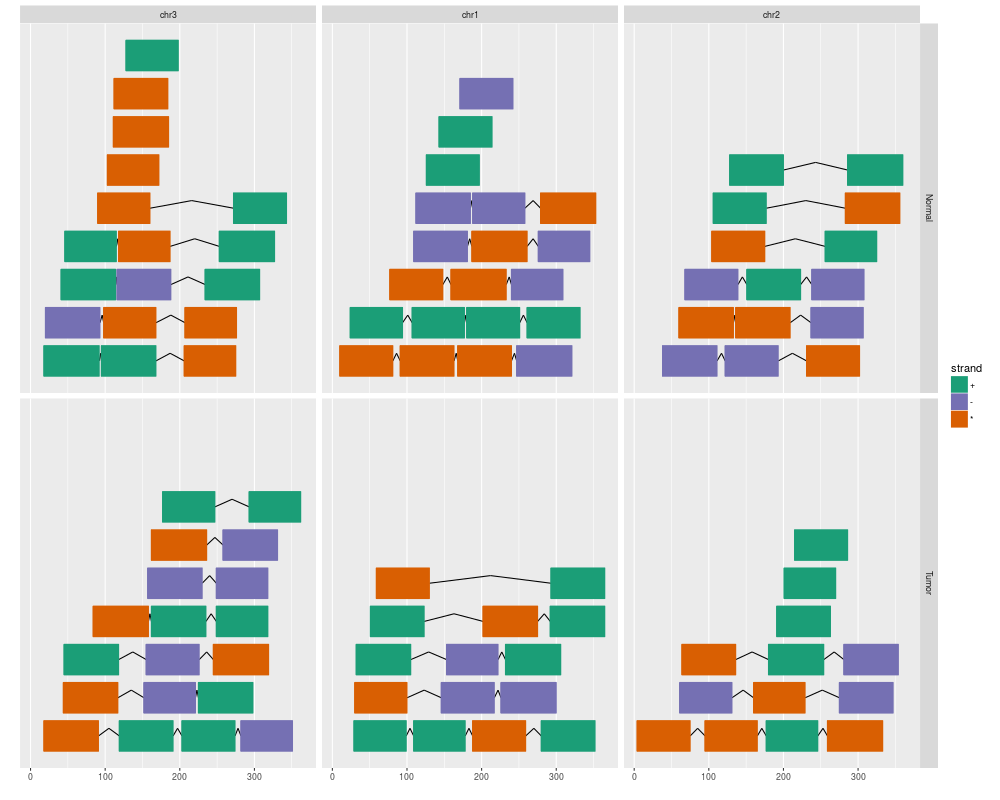
## ======================================================================
## facetting and aesthetics
## ======================================================================
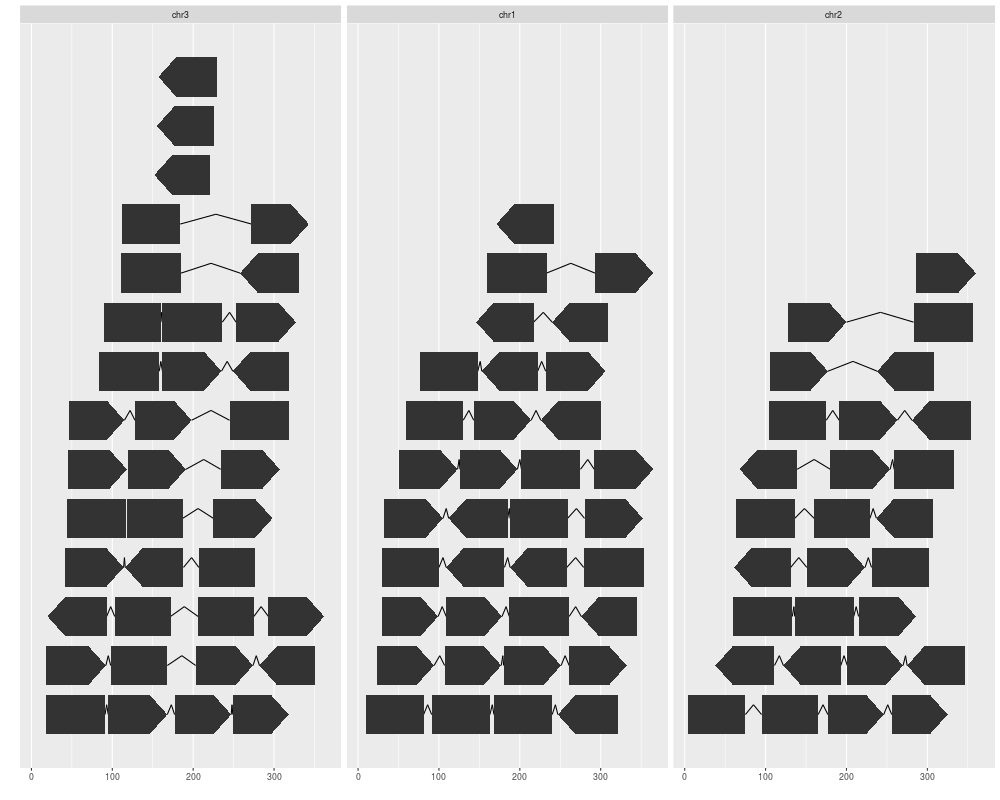
ggplot(gr) + geom_alignment(facets = sample ~ seqnames, aes(color = strand, fill = strand))
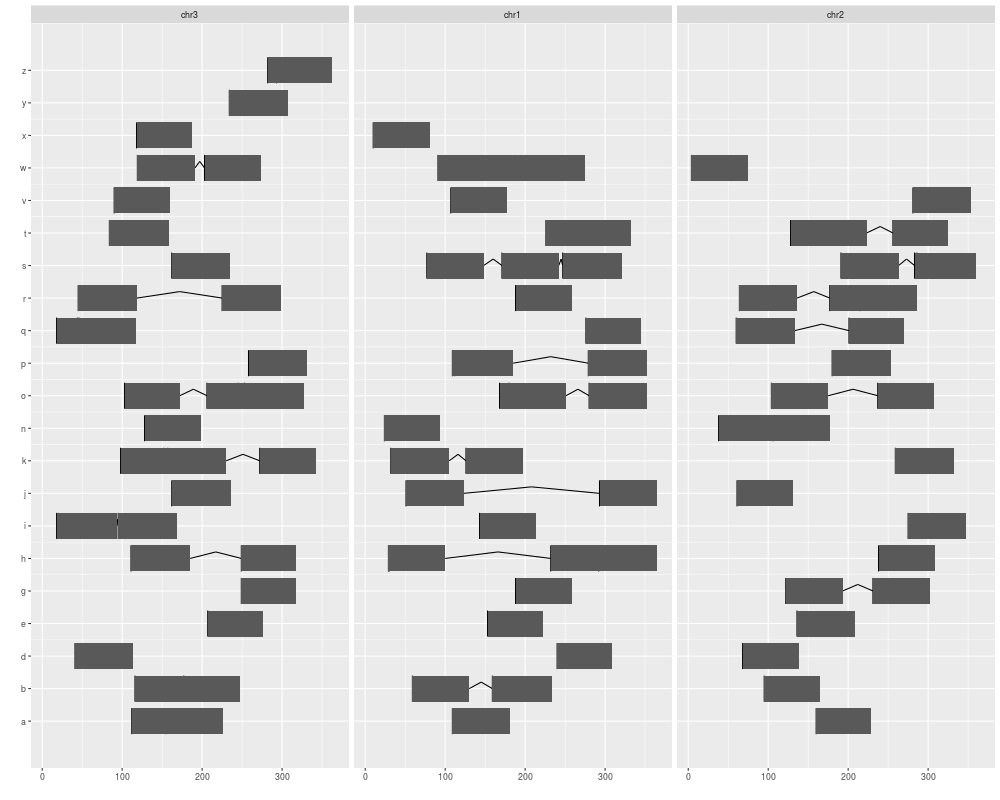
## ======================================================================
## stat:stepping
## ======================================================================
ggplot(gr) + geom_alignment(stat = "stepping", aes(group = pair))
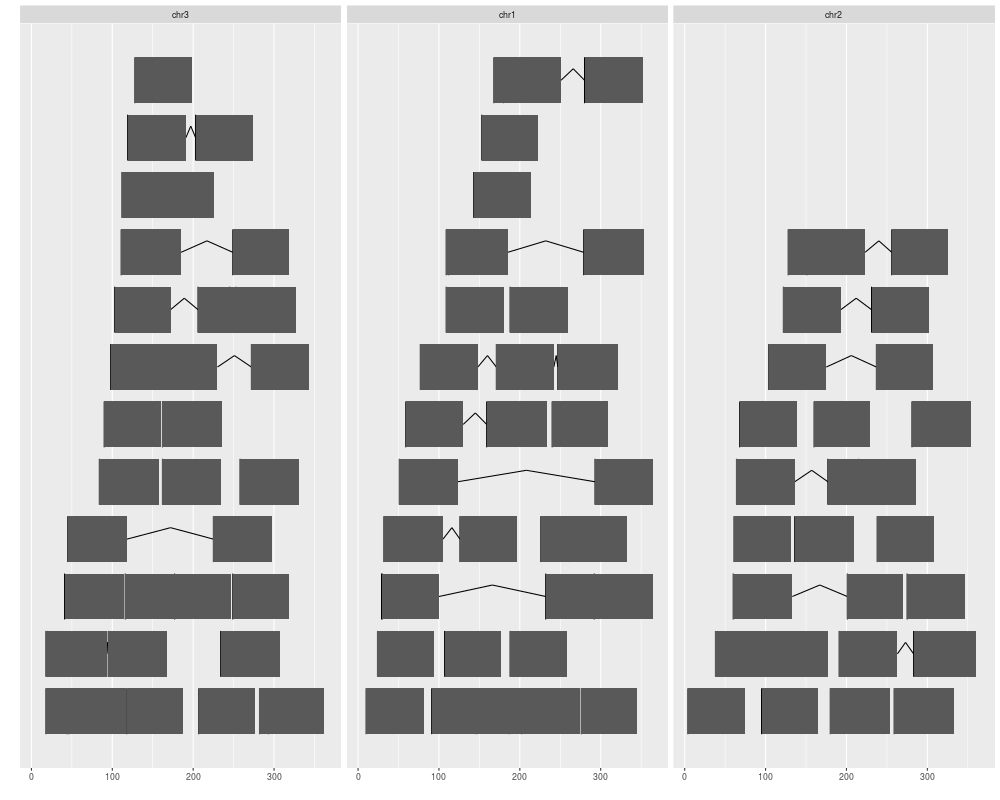
## ======================================================================
## group.selfish controls when
## ======================================================================
ggplot(gr) + geom_alignment(stat = "stepping", aes(group = pair), group.selfish = FALSE)
## =======================================
## main/gap geom
## =======================================
ggplot(gr) + geom_alignment(range.geom = "arrowrect", gap.geom = "chevron")
## =======================================
## For TxDb
## =======================================
library(TxDb.Hsapiens.UCSC.hg19.knownGene)
data(genesymbol, package = "biovizBase")
txdb <- TxDb.Hsapiens.UCSC.hg19.knownGene
## made a track comparing full/reduce stat.
ggbio() + geom_alignment(data = txdb, which = genesymbol["RBM17"])
p1 <- ggplot(txdb) + geom_alignment(which = genesymbol["RBM17"])
p1
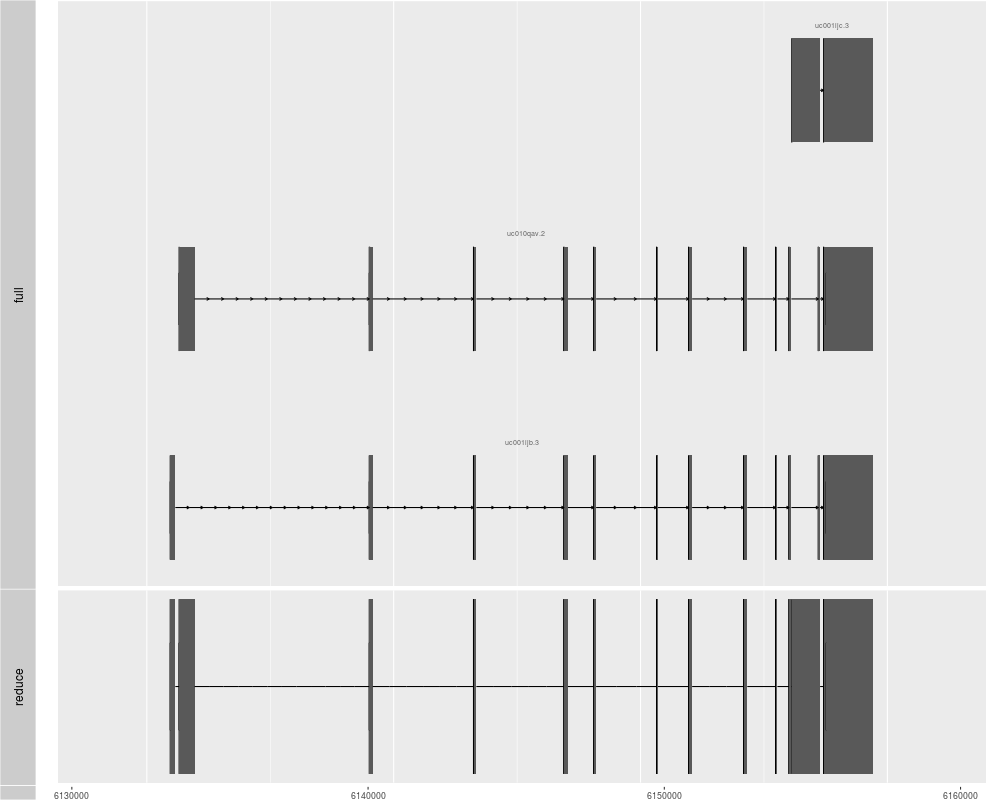
p2 <- ggplot(txdb) + geom_alignment(which = genesymbol["RBM17"], stat = "reduce")
tracks(full = p1, reduce = p2, heights = c(3, 1))
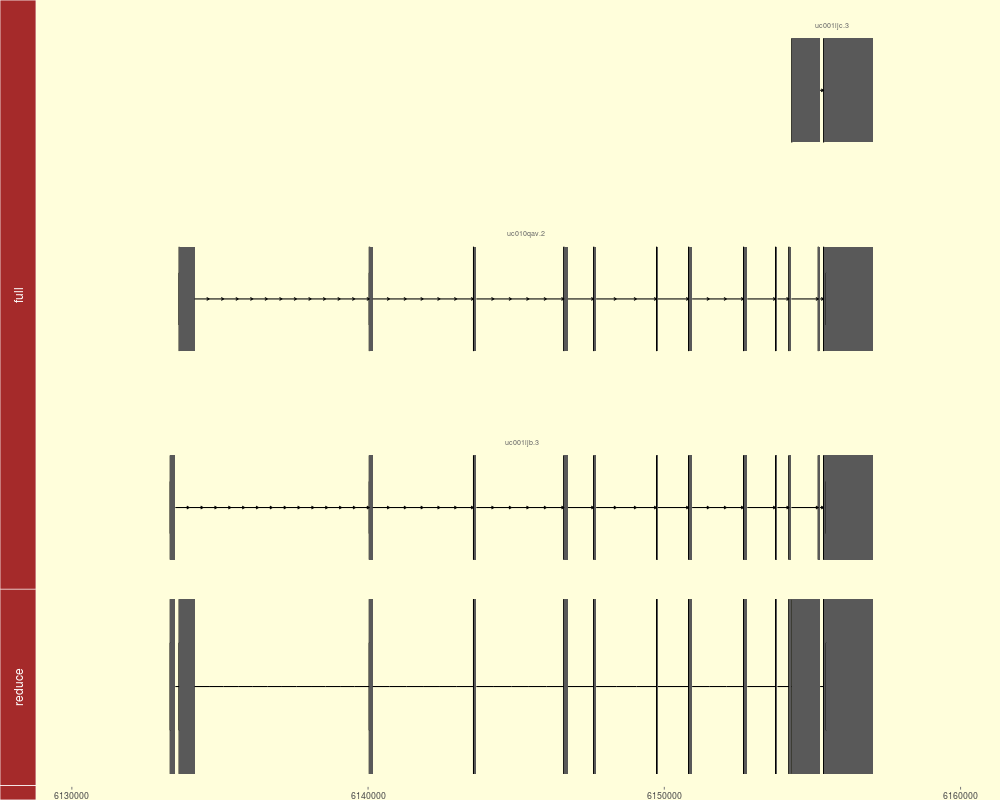
tracks(full = p1, reduce = p2, heights = c(3, 1)) + theme_tracks_sunset()
tracks(full = p1, reduce = p2, heights = c(3, 1)) +
theme_tracks_sunset(axis.line.color = NA)
## change y labels
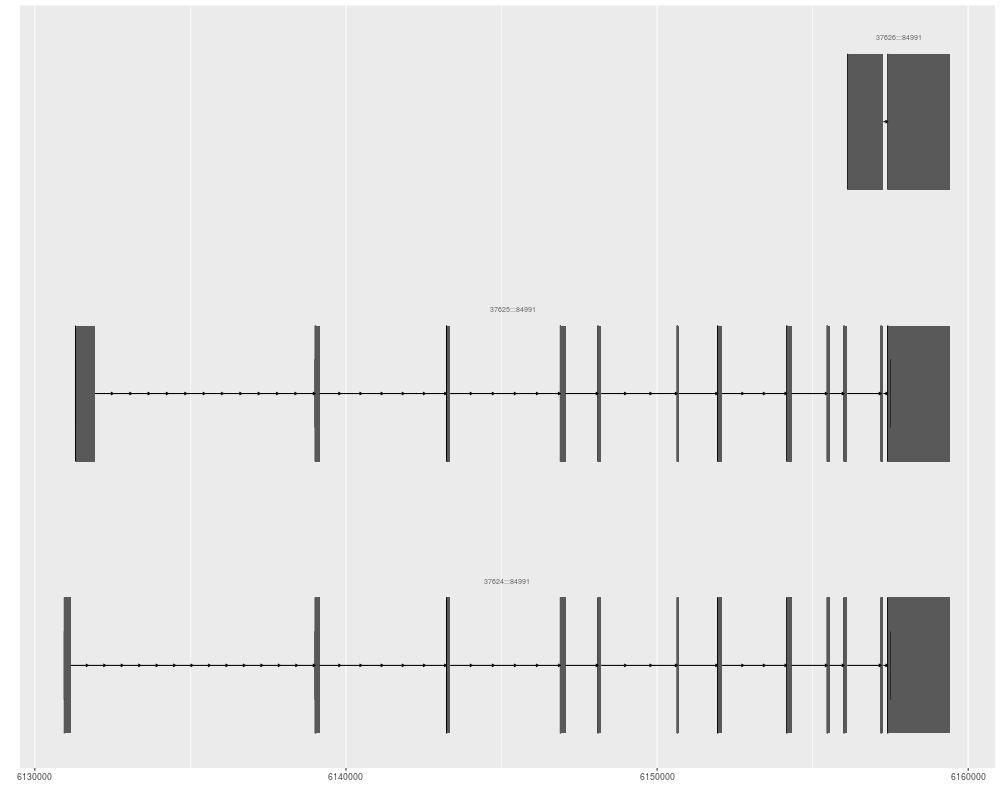
ggplot(txdb) + geom_alignment(which = genesymbol["RBM17"], names.expr = "tx_id:::gene_id")
Results
R version 3.3.1 (2016-06-21) -- "Bug in Your Hair"
Copyright (C) 2016 The R Foundation for Statistical Computing
Platform: x86_64-pc-linux-gnu (64-bit)

R is free software and comes with ABSOLUTELY NO WARRANTY.
You are welcome to redistribute it under certain conditions.
Type 'license()' or 'licence()' for distribution details.

R is a collaborative project with many contributors.
Type 'contributors()' for more information and
'citation()' on how to cite R or R packages in publications.

Type 'demo()' for some demos, 'help()' for on-line help, or
'help.start()' for an HTML browser interface to help.
Type 'q()' to quit R.

> library(ggbio)
Loading required package: BiocGenerics
Loading required package: parallel

Attaching package: 'BiocGenerics'

The following objects are masked from 'package:parallel':

    clusterApply, clusterApplyLB, clusterCall, clusterEvalQ,
    clusterExport, clusterMap, parApply, parCapply, parLapply,
    parLapplyLB, parRapply, parSapply, parSapplyLB

The following objects are masked from 'package:stats':

    IQR, mad, xtabs

The following objects are masked from 'package:base':

    Filter, Find, Map, Position, Reduce, anyDuplicated, append,
    as.data.frame, cbind, colnames, do.call, duplicated, eval, evalq,
    get, grep, grepl, intersect, is.unsorted, lapply, lengths, mapply,
    match, mget, order, paste, pmax, pmax.int, pmin, pmin.int, rank,
    rbind, rownames, sapply, setdiff, sort, table, tapply, union,
    unique, unsplit

Loading required package: ggplot2
Need specific help about ggbio? try mailing
 the maintainer or visit http://tengfei.github.com/ggbio/

Attaching package: 'ggbio'

The following objects are masked from 'package:ggplot2':

    geom_bar, geom_rect, geom_segment, ggsave, stat_bin, stat_identity,
    xlim

Warning message:
replacing previous import 'ggplot2::Position' by 'BiocGenerics::Position' when loading 'ggbio'
> png(filename="/home/ddbj/snapshot/RGM3/R_BC/result/ggbio/geom_alignment-method.Rd_%03d_medium.png", width=480, height=480)
> ### Name: geom_alignment
> ### Title: Alignment geoms for GRanges object
> ### Aliases: geom_alignment geom_alignment,GRanges-method
> ###   geom_alignment,GRangesList-method geom_alignment,OrganismDb-method
> ###   geom_alignment,missing-method geom_alignment,uneval-method
> ###   geom_alignment,TxDbOREnsDb-method geom_alignment,BamFile-method
>
> ### ** Examples
>
> set.seed(1)
> N <- 100
> require(GenomicRanges)
Loading required package: GenomicRanges
Loading required package: S4Vectors
Loading required package: stats4

Attaching package: 'S4Vectors'

The following objects are masked from 'package:base':

    colMeans, colSums, expand.grid, rowMeans, rowSums

Loading required package: IRanges
Loading required package: GenomeInfoDb
> ## ======================================================================
> ##  simmulated GRanges
> ## ======================================================================
> gr <- GRanges(seqnames =
+               sample(c("chr1", "chr2", "chr3"),
+                      size = N, replace = TRUE),
+               IRanges(
+                       start = sample(1:300, size = N, replace = TRUE),
+                       width = sample(70:75, size = N,replace = TRUE)),
+               strand = sample(c("+", "-", "*"), size = N,
+                 replace = TRUE),
+               value = rnorm(N, 10, 3), score = rnorm(N, 100, 30),
+               sample = sample(c("Normal", "Tumor"),
+                 size = N, replace = TRUE),
+               pair = sample(letters, size = N,
+                 replace = TRUE))
>
>
> ## ======================================================================
> ##  default
> ## ======================================================================
> ggplot(gr) + geom_alignment()
> ## or
> ggplot() + geom_alignment(gr)
>
> ## ======================================================================
> ##  facetting and aesthetics
> ## ======================================================================
> ggplot(gr) + geom_alignment(facets = sample ~ seqnames, aes(color = strand, fill = strand))
Scale for 'colour' is already present. Adding another scale for 'colour',
which will replace the existing scale.
Scale for 'fill' is already present. Adding another scale for 'fill', which
will replace the existing scale.
>
> ## ======================================================================
> ##  stat:stepping
> ## ======================================================================
> ggplot(gr) + geom_alignment(stat = "stepping", aes(group = pair))
>
> ## ======================================================================
> ##  group.selfish controls when
> ## ======================================================================
> ggplot(gr) + geom_alignment(stat = "stepping", aes(group = pair), group.selfish = FALSE)
>
> ## =======================================
> ##  main/gap geom
> ## =======================================
> ggplot(gr) + geom_alignment(range.geom = "arrowrect", gap.geom = "chevron")
>
> ## =======================================
> ##  For TxDb
> ## =======================================
> library(TxDb.Hsapiens.UCSC.hg19.knownGene)
Loading required package: GenomicFeatures
Loading required package: AnnotationDbi
Loading required package: Biobase
Welcome to Bioconductor

    Vignettes contain introductory material; view with
    'browseVignettes()'. To cite Bioconductor, see
    'citation("Biobase")', and for packages 'citation("pkgname")'.

> data(genesymbol, package = "biovizBase")
> txdb <- TxDb.Hsapiens.UCSC.hg19.knownGene
> ## made a track comparing full/reduce stat.
> ggbio() + geom_alignment(data = txdb, which = genesymbol["RBM17"])
Parsing transcripts...
Parsing exons...
Parsing cds...
Parsing utrs...
------exons...
------cdss...
------introns...
------utr...
aggregating...
Done
"gap" not in any of the valid gene feature terms "cds", "exon", "utr"
Constructing graphics...
> p1 <- ggplot(txdb) + geom_alignment(which = genesymbol["RBM17"])
Parsing transcripts...
Parsing exons...
Parsing cds...
Parsing utrs...
------exons...
------cdss...
------introns...
------utr...
aggregating...
Done
"gap" not in any of the valid gene feature terms "cds", "exon", "utr"
Constructing graphics...
> p1
> p2 <- ggplot(txdb) + geom_alignment(which = genesymbol["RBM17"], stat = "reduce")
Parsing transcripts...
Parsing exons...
Parsing cds...
Parsing utrs...
------exons...
------cdss...
------introns...
------utr...
aggregating...
Done
"gap" not in any of the valid gene feature terms "cds", "exon", "utr"
Constructing graphics...
reduce alignemnts...
> tracks(full = p1, reduce = p2, heights = c(3, 1))
> tracks(full = p1, reduce = p2, heights = c(3, 1)) + theme_tracks_sunset()
> tracks(full = p1, reduce = p2, heights = c(3, 1)) +
+      theme_tracks_sunset(axis.line.color = NA)
> ## change y labels
> ggplot(txdb) + geom_alignment(which = genesymbol["RBM17"], names.expr = "tx_id:::gene_id")
Parsing transcripts...
Parsing exons...
Parsing cds...
Parsing utrs...
------exons...
------cdss...
------introns...
------utr...
aggregating...
Done
"gap" not in any of the valid gene feature terms "cds", "exon", "utr"
Constructing graphics...
>
>
>
>
>
> dev.off()
null device
          1
>
 .
.