Supported by Dr. Osamu Ogasawara and  . . |
|
Last data update: 2014.03.03 |
Arch geoms for GRanges objectDescriptionShow interval data as arches. Usage
## S4 method for signature 'data.frame'
geom_arch(data, ..., n = 25, max.height = 10)


## S4 method for signature 'GRanges'
geom_arch(data, ..., xlab, ylab, main, facets = NULL,
                 rect.height = 0, n = 25, max.height = 10)
Arguments
DetailsTo draw a interval data as arches, we need to provide a special geom for
this purpose. Arches is popular in gene viewer or genomoe browser,
when they try to show isoforms or gene model. ValueA 'Layer'. Author(s)Tengfei Yin Examples
set.seed(1)
N <- 100
library(GenomicRanges)
## =======================================
## simmulated GRanges
## =======================================
gr <- GRanges(seqnames =
sample(c("chr1", "chr2", "chr3"),
size = N, replace = TRUE),
IRanges(
start = sample(1:300, size = N, replace = TRUE),
width = sample(70:75, size = N,replace = TRUE)),
strand = sample(c("+", "-", "*"), size = N,
replace = TRUE),
value = rnorm(N, 10, 3), score = rnorm(N, 100, 30),
sample = sample(c("Normal", "Tumor"),
size = N, replace = TRUE),
pair = sample(letters, size = N,
replace = TRUE))
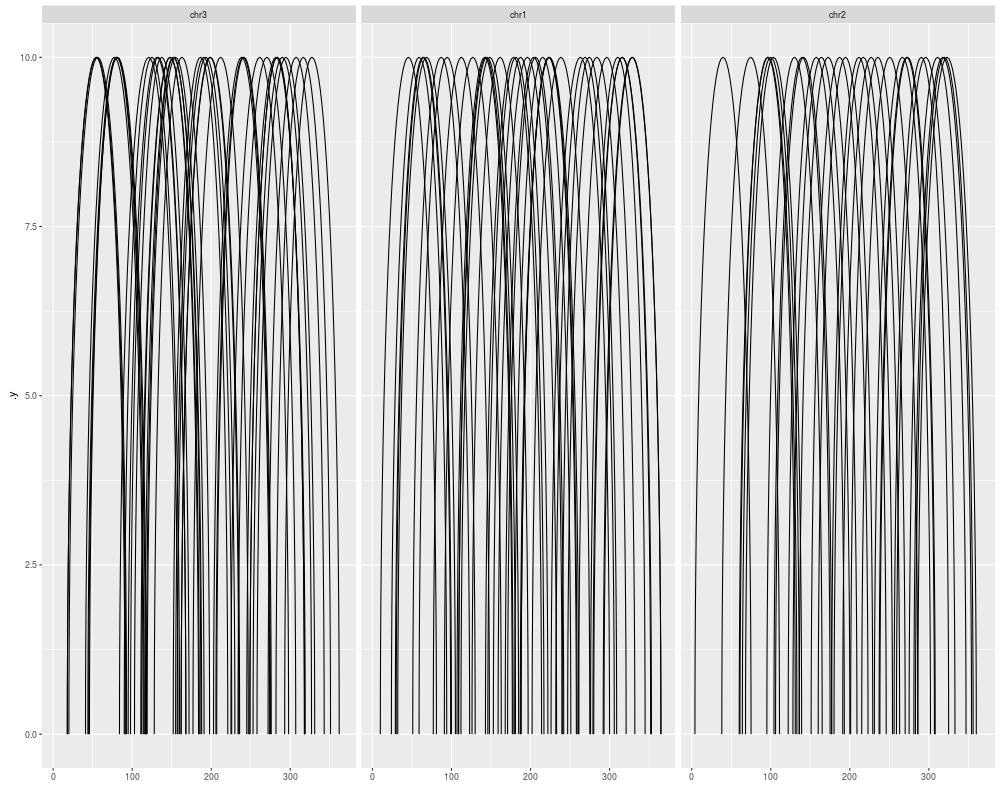
## =======================================
## default
## =======================================
ggplot(gr) + geom_arch()
# or
ggplot() + geom_arch(gr)
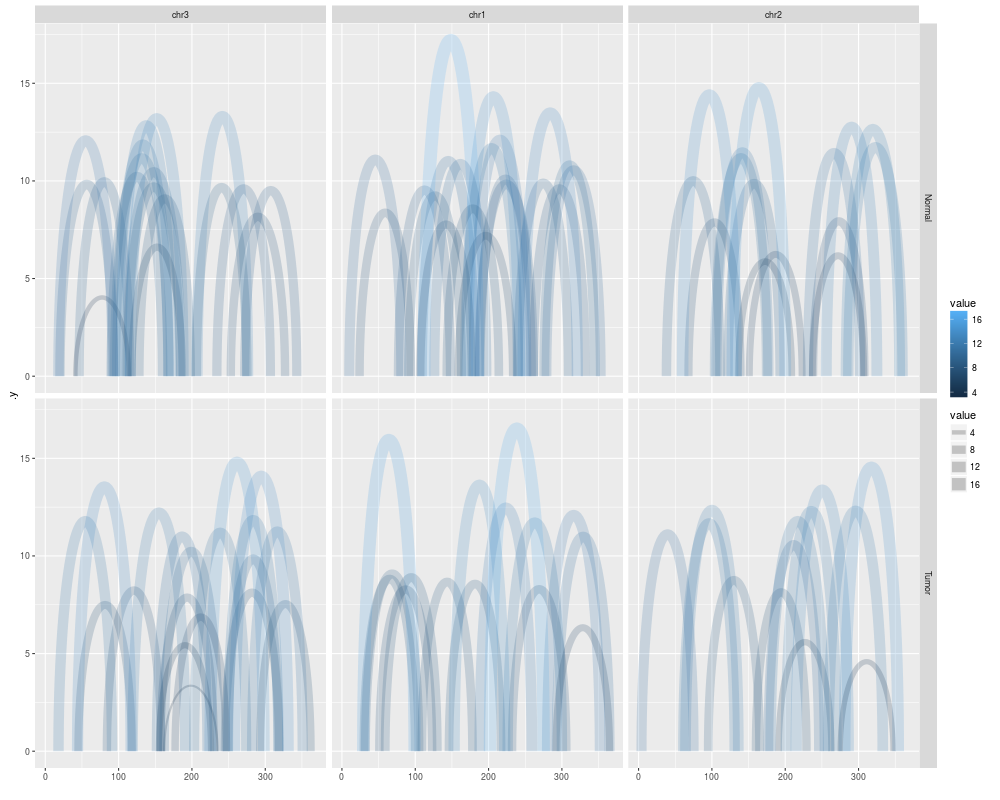
## =======================================
## facetting and aesthetics
## =======================================
ggplot(gr) + geom_arch(aes(color = value, height = value, size = value),
alpha = 0.2, facets = sample ~ seqnames)
Results
R version 3.3.1 (2016-06-21) -- "Bug in Your Hair"
Copyright (C) 2016 The R Foundation for Statistical Computing
Platform: x86_64-pc-linux-gnu (64-bit)

R is free software and comes with ABSOLUTELY NO WARRANTY.
You are welcome to redistribute it under certain conditions.
Type 'license()' or 'licence()' for distribution details.

R is a collaborative project with many contributors.
Type 'contributors()' for more information and
'citation()' on how to cite R or R packages in publications.

Type 'demo()' for some demos, 'help()' for on-line help, or
'help.start()' for an HTML browser interface to help.
Type 'q()' to quit R.

> library(ggbio)
Loading required package: BiocGenerics
Loading required package: parallel

Attaching package: 'BiocGenerics'

The following objects are masked from 'package:parallel':

    clusterApply, clusterApplyLB, clusterCall, clusterEvalQ,
    clusterExport, clusterMap, parApply, parCapply, parLapply,
    parLapplyLB, parRapply, parSapply, parSapplyLB

The following objects are masked from 'package:stats':

    IQR, mad, xtabs

The following objects are masked from 'package:base':

    Filter, Find, Map, Position, Reduce, anyDuplicated, append,
    as.data.frame, cbind, colnames, do.call, duplicated, eval, evalq,
    get, grep, grepl, intersect, is.unsorted, lapply, lengths, mapply,
    match, mget, order, paste, pmax, pmax.int, pmin, pmin.int, rank,
    rbind, rownames, sapply, setdiff, sort, table, tapply, union,
    unique, unsplit

Loading required package: ggplot2
Need specific help about ggbio? try mailing
 the maintainer or visit http://tengfei.github.com/ggbio/

Attaching package: 'ggbio'

The following objects are masked from 'package:ggplot2':

    geom_bar, geom_rect, geom_segment, ggsave, stat_bin, stat_identity,
    xlim

Warning message:
replacing previous import 'ggplot2::Position' by 'BiocGenerics::Position' when loading 'ggbio'
> png(filename="/home/ddbj/snapshot/RGM3/R_BC/result/ggbio/geom_arch-method.Rd_%03d_medium.png", width=480, height=480)
> ### Name: geom_arch
> ### Title: Arch geoms for GRanges object
> ### Aliases: geom_arch geom_arch,data.frame-method geom_arch,GRanges-method
> ###   geom_arch,missing-method geom_arch,uneval-method
>
> ### ** Examples
>
> set.seed(1)
> N <- 100
> library(GenomicRanges)
Loading required package: S4Vectors
Loading required package: stats4

Attaching package: 'S4Vectors'

The following objects are masked from 'package:base':

    colMeans, colSums, expand.grid, rowMeans, rowSums

Loading required package: IRanges
Loading required package: GenomeInfoDb
>
> ## =======================================
> ##  simmulated GRanges
> ## =======================================
> gr <- GRanges(seqnames =
+               sample(c("chr1", "chr2", "chr3"),
+                      size = N, replace = TRUE),
+               IRanges(
+                       start = sample(1:300, size = N, replace = TRUE),
+                       width = sample(70:75, size = N,replace = TRUE)),
+               strand = sample(c("+", "-", "*"), size = N,
+                 replace = TRUE),
+               value = rnorm(N, 10, 3), score = rnorm(N, 100, 30),
+               sample = sample(c("Normal", "Tumor"),
+                 size = N, replace = TRUE),
+               pair = sample(letters, size = N,
+                 replace = TRUE))
>
> ## =======================================
> ##  default
> ## =======================================
> ggplot(gr) + geom_arch()
> # or
> ggplot() + geom_arch(gr)
>
> ## =======================================
> ##  facetting and aesthetics
> ## =======================================
> ggplot(gr) + geom_arch(aes(color = value, height = value, size = value),
+                      alpha = 0.2, facets = sample ~ seqnames)
>
>
>
>
>
>
>
> dev.off()
null device
          1
>
|