R: Plot fluorescence intensity in one or two dimension.
autoplot.flowSet
R Documentation
Plot fluorescence intensity in one or two dimension.
Description
Overloaded autoplot for the cytomertry data structure: flowFrame or flowSet, Gatinghierarchy, GatingSet.
It plots the cytometry data with geom_histogram, geom_density or geom_hex.
Usage
## S3 method for class 'flowSet'
autoplot(object, x, y = NULL, bins = 30, ...)

## S3 method for class 'flowFrame'
autoplot(object, ...)

## S3 method for class 'GatingSet'
autoplot(object, gate, x = NULL, y = "SSC-A",
  bins = 30, ...)

## S3 method for class 'GatingHierarchy'
autoplot(object, gate, y = "SSC-A", bool = FALSE,
  arrange.main = sampleNames(object), arrange = TRUE, merge = TRUE,
  projections = list(), strip.text = c("parent", "gate"), ...)
Arguments
object
flowFrame, flowSet, GatingSet object
x,y
define the dimension of the plot
bins
passed to geom_hex
...
other arguments passed to ggplot
gate
the gate to be plotted
bool
whether to plot boolean gates
arrange.main
the main title of the arranged plots
arrange
whether to use arrangeGrob to put multiple plots in the same page
merge
wehther to merge multiple gates into the same panel when they share the same parent and projections
projections
a list of customized projections
strip.text
either "parent" (the parent population name) or "gate "(the gate name). The latter usually is used when merge is FALSE
Value
a ggcyto object
Examples
library(flowCore)
data(GvHD)
fs <- GvHD[subset(pData(GvHD), Patient %in%5:7 & Visit %in% c(5:6))[["name"]]]
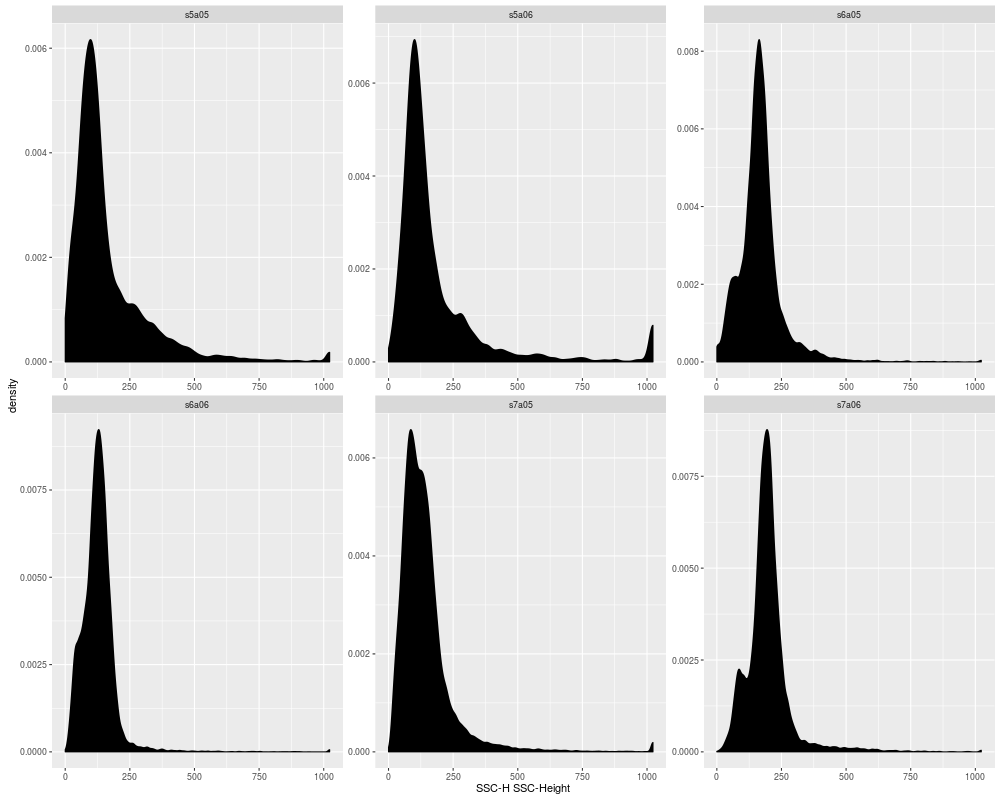
#1d- density plot
autoplot(fs, x = "SSC-H")
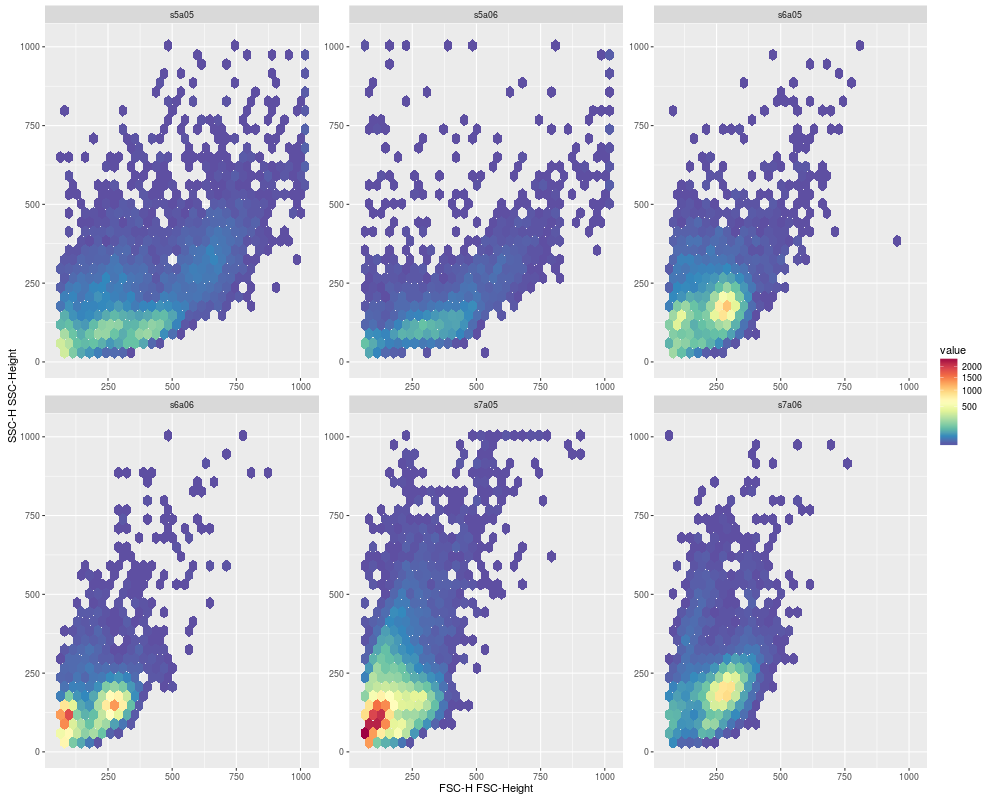
#2d plot: default geom_hex plot
autoplot(fs, x = 'FSC-H', y ='SSC-H')
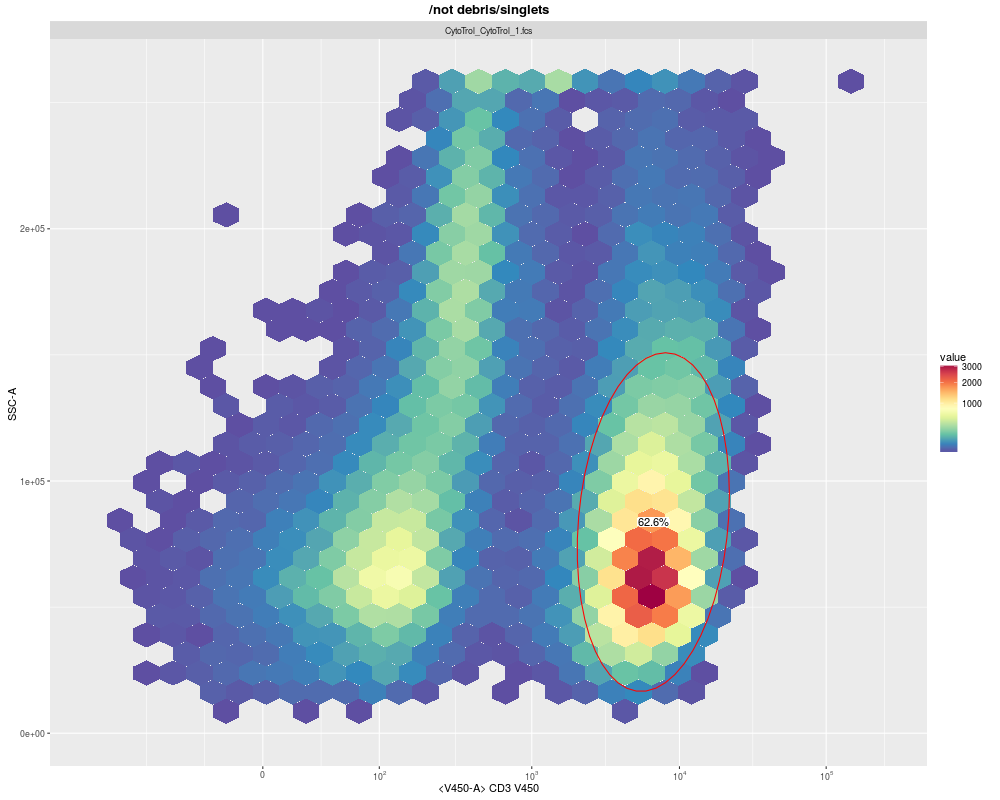
#autplot for GatingSet
dataDir <- system.file("extdata",package="flowWorkspaceData")
gs <- load_gs(list.files(dataDir, pattern = "gs_manual",full = TRUE))
autoplot(gs, "CD3+")
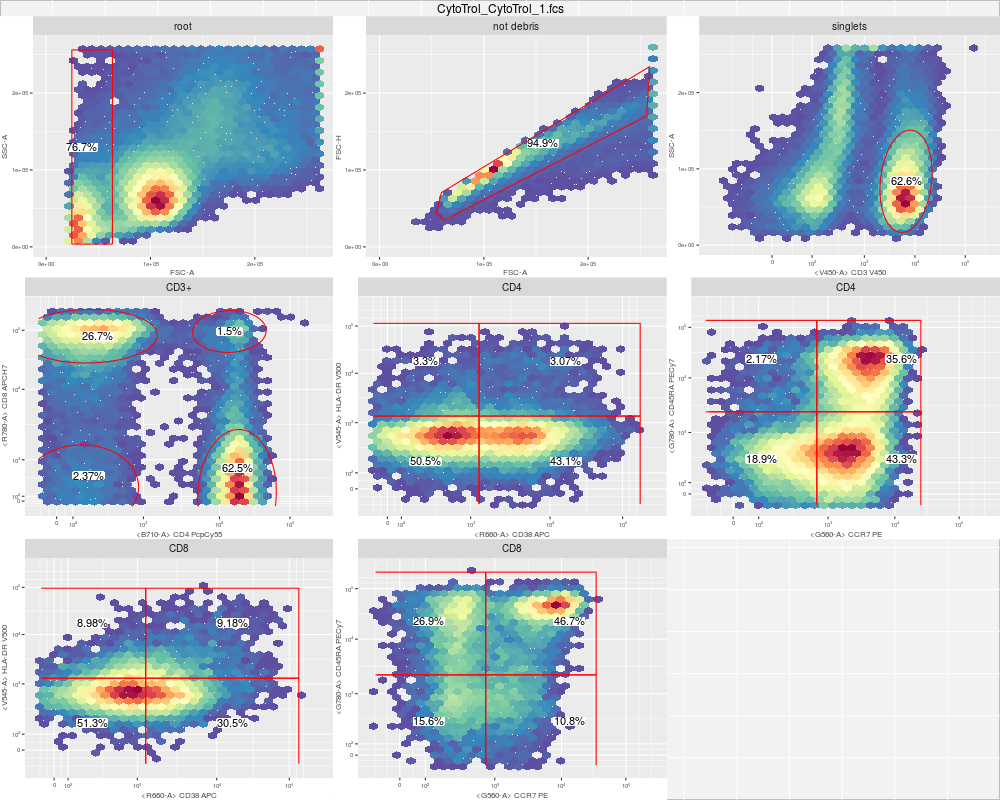
#autplot for GatingHierarchy
gh <- gs[[1]]
autoplot(gh) # by default the strip.text shows the parent population
#To display the gate name
#autoplot(gh , strip.text = "gate")
Results
R version 3.3.1 (2016-06-21) -- "Bug in Your Hair"
Copyright (C) 2016 The R Foundation for Statistical Computing
Platform: x86_64-pc-linux-gnu (64-bit)

R is free software and comes with ABSOLUTELY NO WARRANTY.
You are welcome to redistribute it under certain conditions.
Type 'license()' or 'licence()' for distribution details.

R is a collaborative project with many contributors.
Type 'contributors()' for more information and
'citation()' on how to cite R or R packages in publications.

Type 'demo()' for some demos, 'help()' for on-line help, or
'help.start()' for an HTML browser interface to help.
Type 'q()' to quit R.

> library(ggcyto)
Loading required package: ggplot2
Loading required package: flowCore
Loading required package: ncdfFlow
Loading required package: flowViz
Loading required package: lattice
Loading required package: RcppArmadillo
Loading required package: BH
Loading required package: flowWorkspace
Loading required package: gridExtra
> png(filename="/home/ddbj/snapshot/RGM3/R_BC/result/ggcyto/autoplot.Rd_%03d_medium.png", width=480, height=480)
> ### Name: autoplot.flowSet
> ### Title: Plot fluorescence intensity in one or two dimension.
> ### Aliases: autoplot.GatingHierarchy autoplot.GatingSet autoplot.flowFrame
> ###   autoplot.flowSet
>
> ### ** Examples
>
> library(flowCore)
> data(GvHD)
> fs <- GvHD[subset(pData(GvHD), Patient %in%5:7 & Visit %in% c(5:6))[["name"]]]
>
> #1d- density plot
> autoplot(fs, x = "SSC-H")
>
> #2d plot: default geom_hex plot
> autoplot(fs, x = 'FSC-H', y ='SSC-H')
Warning message:
Removed 165 rows containing missing values (geom_hex).
>
> #autplot for GatingSet
> dataDir <- system.file("extdata",package="flowWorkspaceData")
> gs <- load_gs(list.files(dataDir, pattern = "gs_manual",full = TRUE))
loading R object...
loading tree object...
Done
> autoplot(gs, "CD3+")
Warning messages:
1: Removed 3 rows containing non-finite values (stat_binhex).
2: Removed 14 rows containing missing values (geom_hex).
>
> #autplot for GatingHierarchy
> gh <- gs[[1]]
> autoplot(gh) # by default the strip.text shows the parent population
There were 22 warnings (use warnings() to see them)
>
> #To display the gate name
> #autoplot(gh , strip.text = "gate")
>
>
>
>
>
> dev.off()
null device
          1
>
 .
.