Supported by Dr. Osamu Ogasawara and  . . |
|
Last data update: 2014.03.03 |
Vertical or horizontal line.DescriptionThis geom is based on the source code of ' Usagegeom_hvline(mapping = NULL, data = NULL, position = "identity", show.legend = FALSE, ...) Arguments
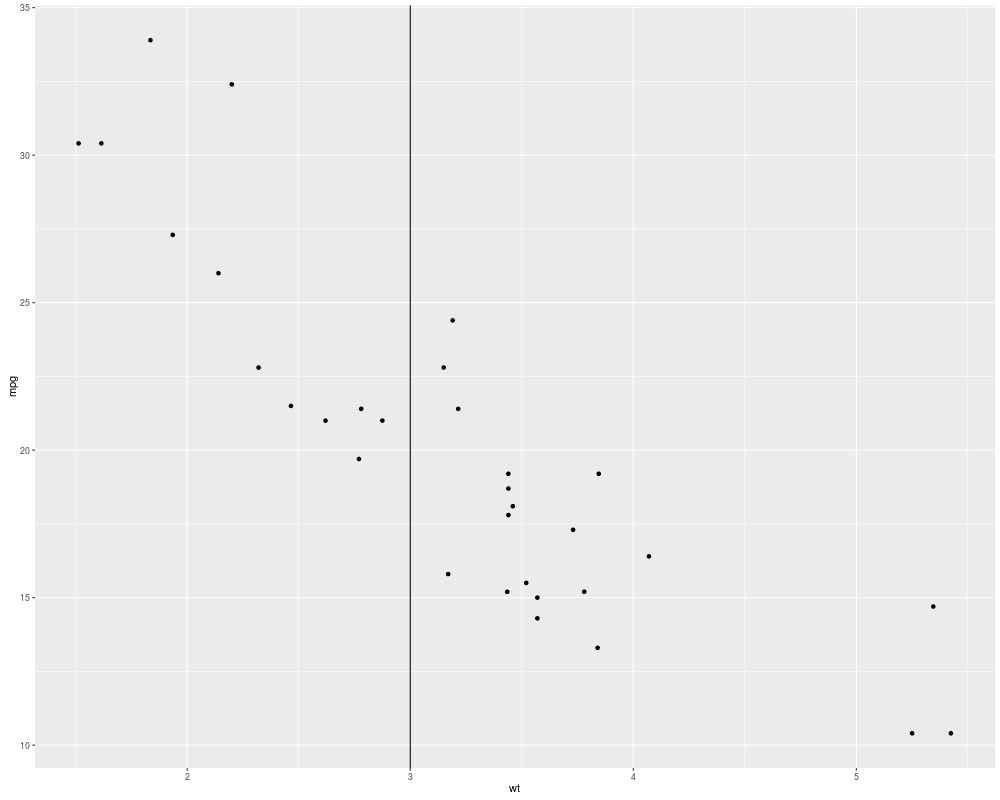
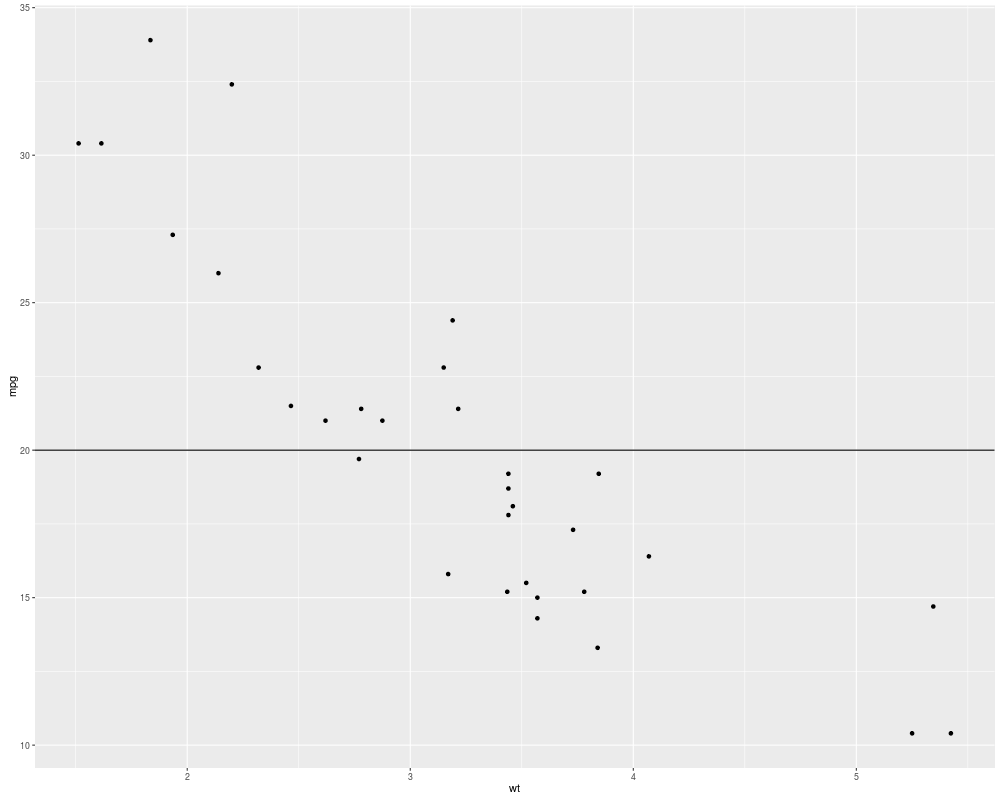
DetailsThe goal is to determine the line to be either vertial or horizontal based on the 1-d data provided in this layer. Valuea geom_hvline layer AestheticsSexpr[results=rd,stage=build]{ggplot2:::rd_aesthetics("geom", "vline")}Examplesp <- ggplot(mtcars, aes(x = wt, y = mpg)) + geom_point() # vline p + geom_hvline(data = data.frame(wt= 3)) # hline p + geom_hvline(data = data.frame(mpg= 20)) Results
R version 3.3.1 (2016-06-21) -- "Bug in Your Hair"
Copyright (C) 2016 The R Foundation for Statistical Computing
Platform: x86_64-pc-linux-gnu (64-bit)

R is free software and comes with ABSOLUTELY NO WARRANTY.
You are welcome to redistribute it under certain conditions.
Type 'license()' or 'licence()' for distribution details.

R is a collaborative project with many contributors.
Type 'contributors()' for more information and
'citation()' on how to cite R or R packages in publications.

Type 'demo()' for some demos, 'help()' for on-line help, or
'help.start()' for an HTML browser interface to help.
Type 'q()' to quit R.

> library(ggcyto)
Loading required package: ggplot2
Loading required package: flowCore
Loading required package: ncdfFlow
Loading required package: flowViz
Loading required package: lattice
Loading required package: RcppArmadillo
Loading required package: BH
Loading required package: flowWorkspace
Loading required package: gridExtra
> png(filename="/home/ddbj/snapshot/RGM3/R_BC/result/ggcyto/geom_hvline.Rd_%03d_medium.png", width=480, height=480)
> ### Name: geom_hvline
> ### Title: Vertical or horizontal line.
> ### Aliases: geom_hvline
>
> ### ** Examples
>
> p <- ggplot(mtcars, aes(x = wt, y = mpg)) + geom_point()
> # vline
> p + geom_hvline(data = data.frame(wt= 3))
> # hline
> p + geom_hvline(data = data.frame(mpg= 20))
>
>
>
>
>
> dev.off()
null device
          1
>
|
Created & Maintained by Osamu Ogasawara (osamu.ogasawara@gmail.com) and 