Supported by Dr. Osamu Ogasawara and  . . |
|
Last data update: 2014.03.03 |
Popluation statistics layerDescriptionIt is a virtual layer and will be instanatiated as geom_label layer within ggycto.+ operator. Usagegeom_stats(gate = NULL, ..., value = NULL, type = "percent", data_range = NULL, adjust = 0.5, label.padding = unit(0.05, "lines"), label.size = 0) Arguments
DetailsSo it is dedicated for ggcyto context and thus can't not be added to ggplot object directly. Valuea geom_popStats layer Examples
dataDir <- system.file("extdata",package="flowWorkspaceData")
gs <- load_gs(list.files(dataDir, pattern = "gs_manual",full = TRUE))
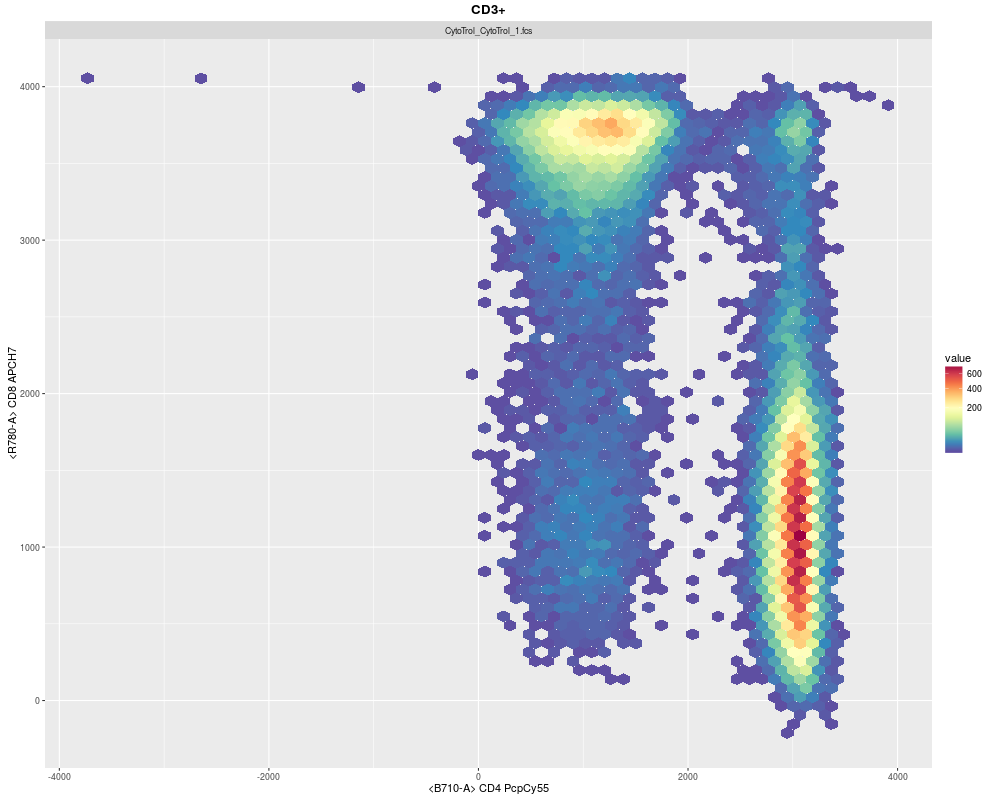
p <- ggcyto(gs, aes(x = CD4, y = CD8), subset = "CD3+") + geom_hex(bins = 64)
p
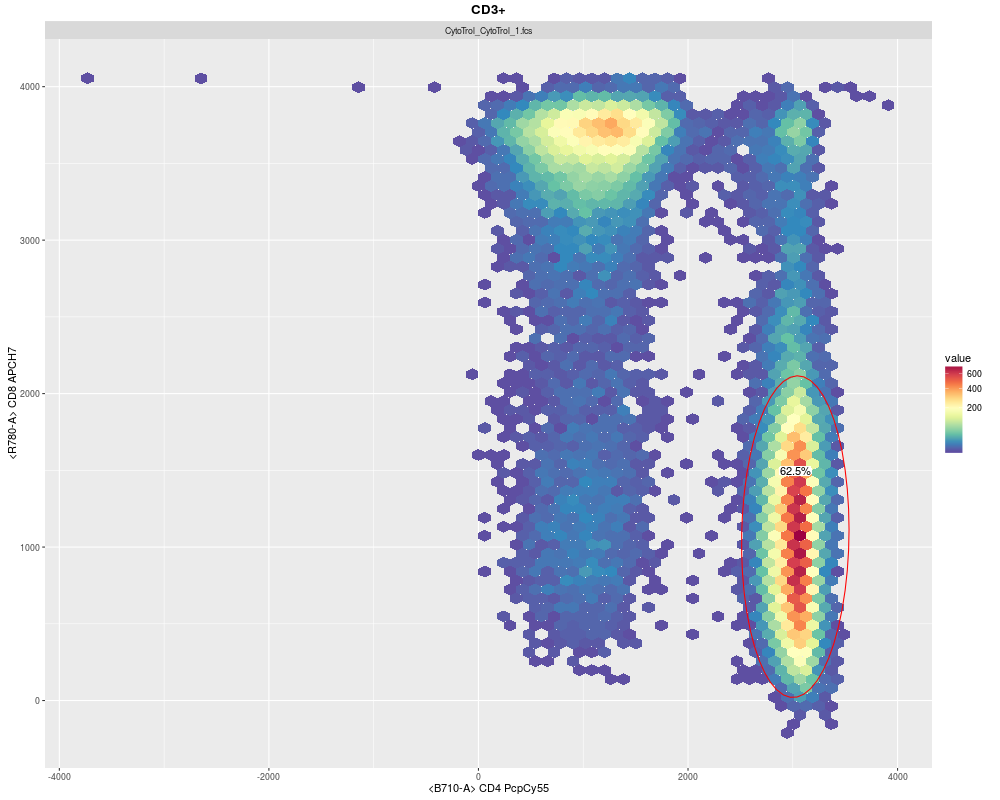
# add gate and stats layer
p + geom_gate("CD4") + geom_stats()
Results
R version 3.3.1 (2016-06-21) -- "Bug in Your Hair"
Copyright (C) 2016 The R Foundation for Statistical Computing
Platform: x86_64-pc-linux-gnu (64-bit)

R is free software and comes with ABSOLUTELY NO WARRANTY.
You are welcome to redistribute it under certain conditions.
Type 'license()' or 'licence()' for distribution details.

R is a collaborative project with many contributors.
Type 'contributors()' for more information and
'citation()' on how to cite R or R packages in publications.

Type 'demo()' for some demos, 'help()' for on-line help, or
'help.start()' for an HTML browser interface to help.
Type 'q()' to quit R.

> library(ggcyto)
Loading required package: ggplot2
Loading required package: flowCore
Loading required package: ncdfFlow
Loading required package: flowViz
Loading required package: lattice
Loading required package: RcppArmadillo
Loading required package: BH
Loading required package: flowWorkspace
Loading required package: gridExtra
> png(filename="/home/ddbj/snapshot/RGM3/R_BC/result/ggcyto/geom_stats.Rd_%03d_medium.png", width=480, height=480)
> ### Name: geom_stats
> ### Title: Popluation statistics layer
> ### Aliases: geom_stats
>
> ### ** Examples
>
> dataDir <- system.file("extdata",package="flowWorkspaceData")
> gs <- load_gs(list.files(dataDir, pattern = "gs_manual",full = TRUE))
loading R object...
loading tree object...
Done
> p <- ggcyto(gs, aes(x = CD4, y = CD8), subset = "CD3+") + geom_hex(bins = 64)
> p
Warning message:
Removed 4 rows containing missing values (geom_hex).
> # add gate and stats layer
> p + geom_gate("CD4") + geom_stats()
Warning message:
Removed 4 rows containing missing values (geom_hex).
>
>
>
>
>
> dev.off()
null device
          1
>
|
Created & Maintained by Osamu Ogasawara (osamu.ogasawara@gmail.com) and 