Supported by Dr. Osamu Ogasawara and  . . |
|
Last data update: 2014.03.03 |
Create a new ggcyto plotDescription
Usageggcyto(data = NULL, ...) ## Default S3 method: ggcyto(data = NULL, mapping = aes(), ...) Arguments
DetailsTo invoke
Valueggcyto object Examplesdata(GvHD) fs <- GvHD[1:3] #construct the `ggcyto` object (inherits from `ggplot` class) p <- ggcyto(fs, aes(x = `FSC-H`)) p + geom_histogram() # display density/area p + geom_density() p + geom_area(stat = "density") # 2d scatter plot p <- ggcyto(fs, aes(x = `FSC-H`, y = `SSC-H`)) p + geom_hex(bins = 128) Results
R version 3.3.1 (2016-06-21) -- "Bug in Your Hair"
Copyright (C) 2016 The R Foundation for Statistical Computing
Platform: x86_64-pc-linux-gnu (64-bit)
R is free software and comes with ABSOLUTELY NO WARRANTY.
You are welcome to redistribute it under certain conditions.
Type 'license()' or 'licence()' for distribution details.
R is a collaborative project with many contributors.
Type 'contributors()' for more information and
'citation()' on how to cite R or R packages in publications.
Type 'demo()' for some demos, 'help()' for on-line help, or
'help.start()' for an HTML browser interface to help.
Type 'q()' to quit R.
> library(ggcyto)
Loading required package: ggplot2
Loading required package: flowCore
Loading required package: ncdfFlow
Loading required package: flowViz
Loading required package: lattice
Loading required package: RcppArmadillo
Loading required package: BH
Loading required package: flowWorkspace
Loading required package: gridExtra
> png(filename="/home/ddbj/snapshot/RGM3/R_BC/result/ggcyto/ggcyto.Rd_%03d_medium.png", width=480, height=480)
> ### Name: ggcyto-class
> ### Title: Create a new ggcyto plot
> ### Aliases: ggcyto ggcyto-class ggcyto.default ggcyto_GatingLayout-class
> ### ggcyto_GatingSet-class ggcyto_flowSet-class
> ### Keywords: internal
>
> ### ** Examples
>
> data(GvHD)
> fs <- GvHD[1:3]
> #construct the `ggcyto` object (inherits from `ggplot` class)
> p <- ggcyto(fs, aes(x = `FSC-H`))
> p + geom_histogram()
`stat_bin()` using `bins = 30`. Pick better value with `binwidth`.
Warning message:
Removed 3 rows containing missing values (geom_bar).
>
> # display density/area
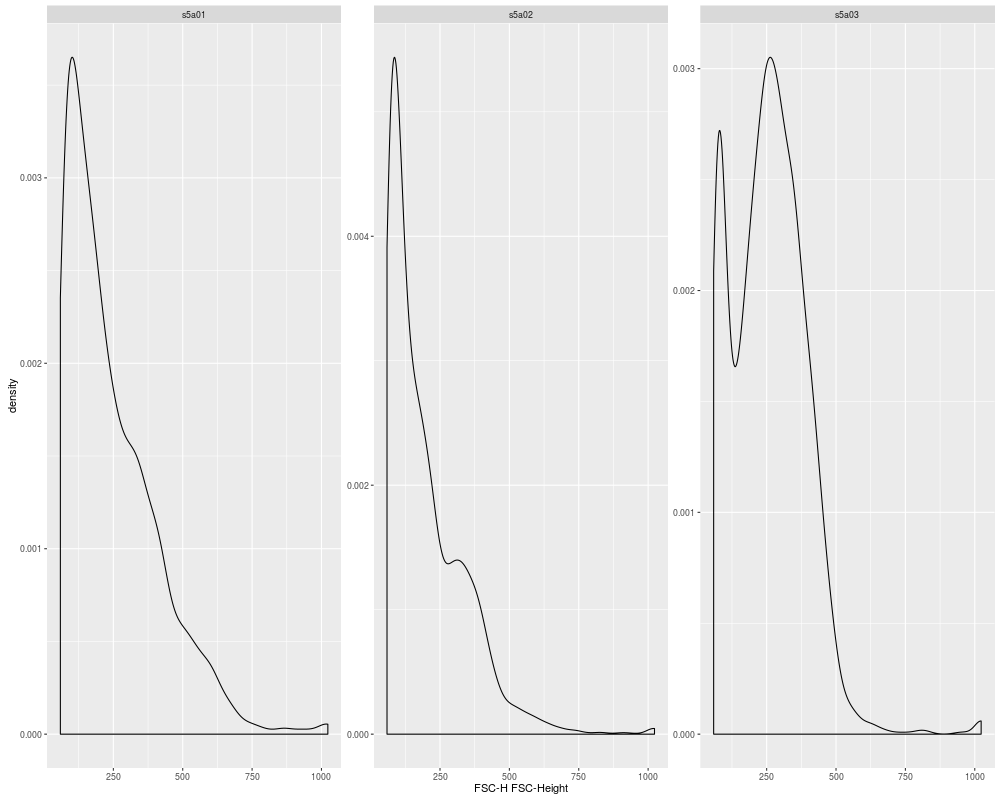
> p + geom_density()
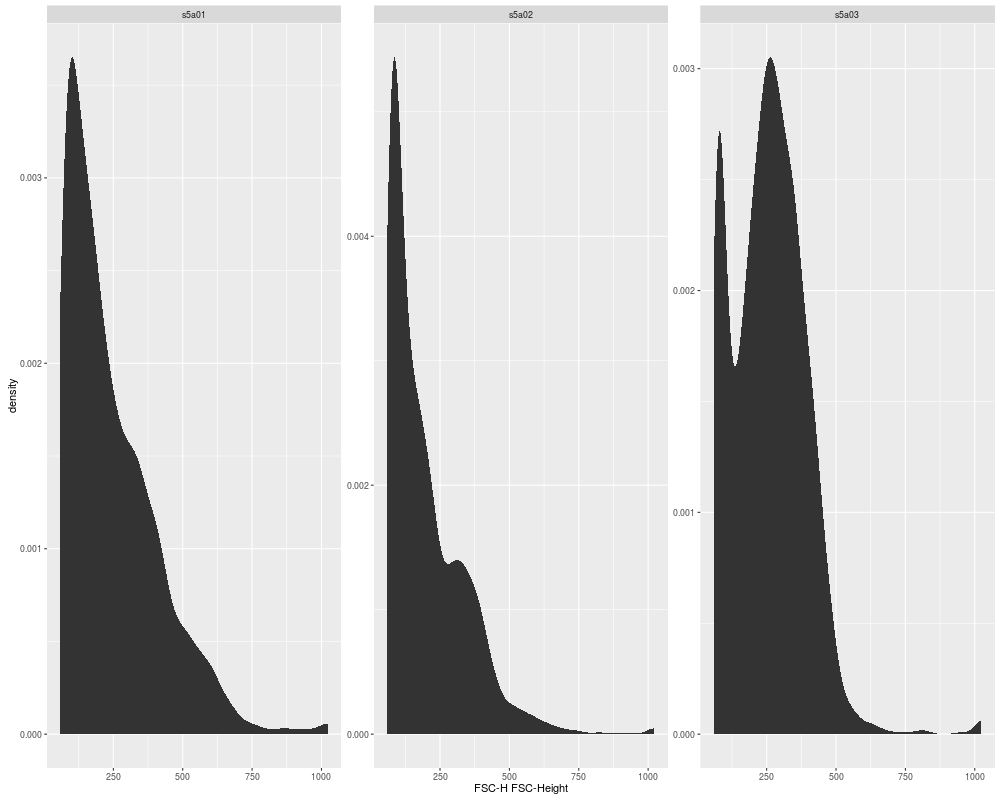
> p + geom_area(stat = "density")
>
> # 2d scatter plot
> p <- ggcyto(fs, aes(x = `FSC-H`, y = `SSC-H`))
> p + geom_hex(bins = 128)
Warning message:
Removed 109 rows containing missing values (geom_hex).
>
>
>
>
>
> dev.off()
null device
1
>
|


Created & Maintained by Osamu Ogasawara (osamu.ogasawara@gmail.com) and 