## S3 method for class 'flowSet'
ggcyto(data, mapping, filter = NULL, ...)
Arguments
data
default flowSet for plot
mapping
default list of aesthetic mappings (these can be colour,
size, shape, line type – see individual geom functions for more details)
filter
a flowcore gate object or a function that takes flowSet and channels as input and returns a data-dependent flowcore gate
The gate is used to filter the flow data before it is plotted.
...
ignored
Value
a ggcyto_GatingSet object which is a subclass of ggcyto class.
Examples
data(GvHD)
fs <- GvHD[subset(pData(GvHD), Patient %in%5:7 & Visit %in% c(5:6))[["name"]]]
# 1d histogram/densityplot
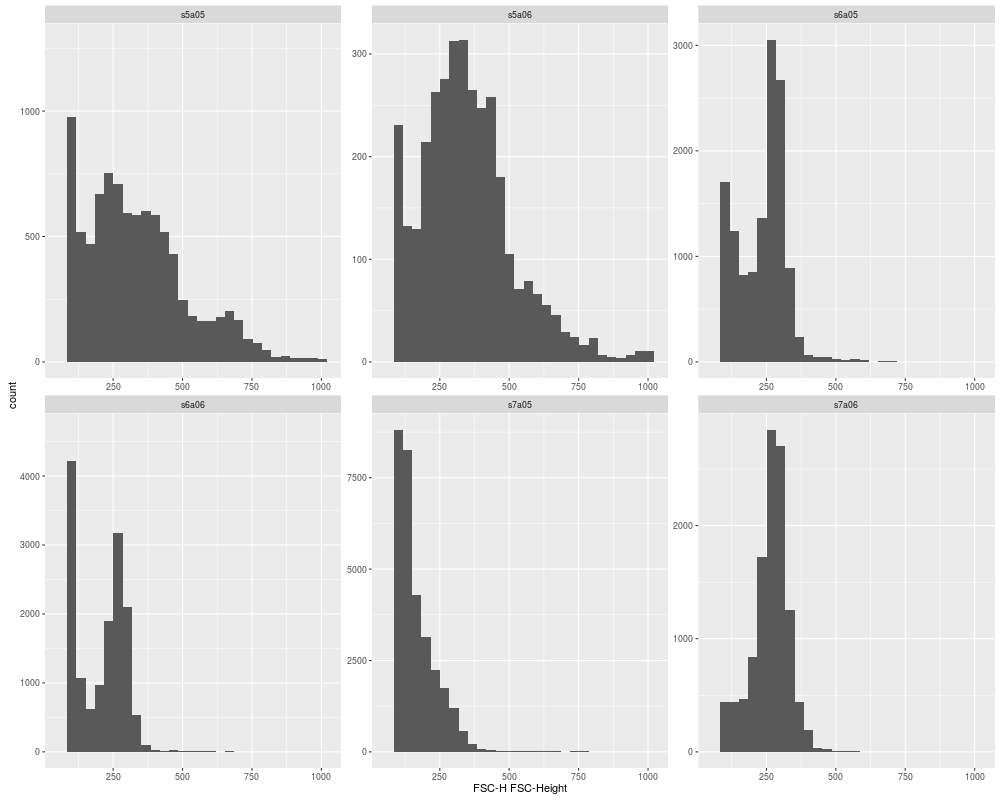
p <- ggcyto(fs, aes(x = `FSC-H`))
#facet_wrap(~name)` is used automatically
p1 <- p + geom_histogram()
p1
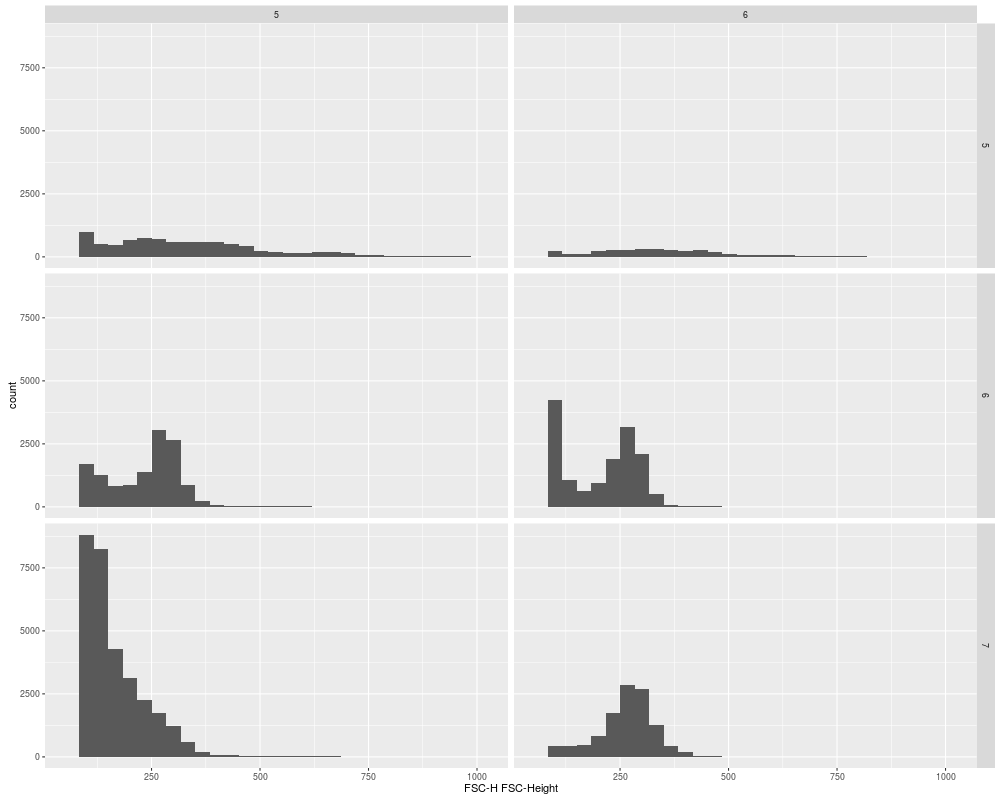
#overwriting the default faceeting
p1 + facet_grid(Patient~Visit)
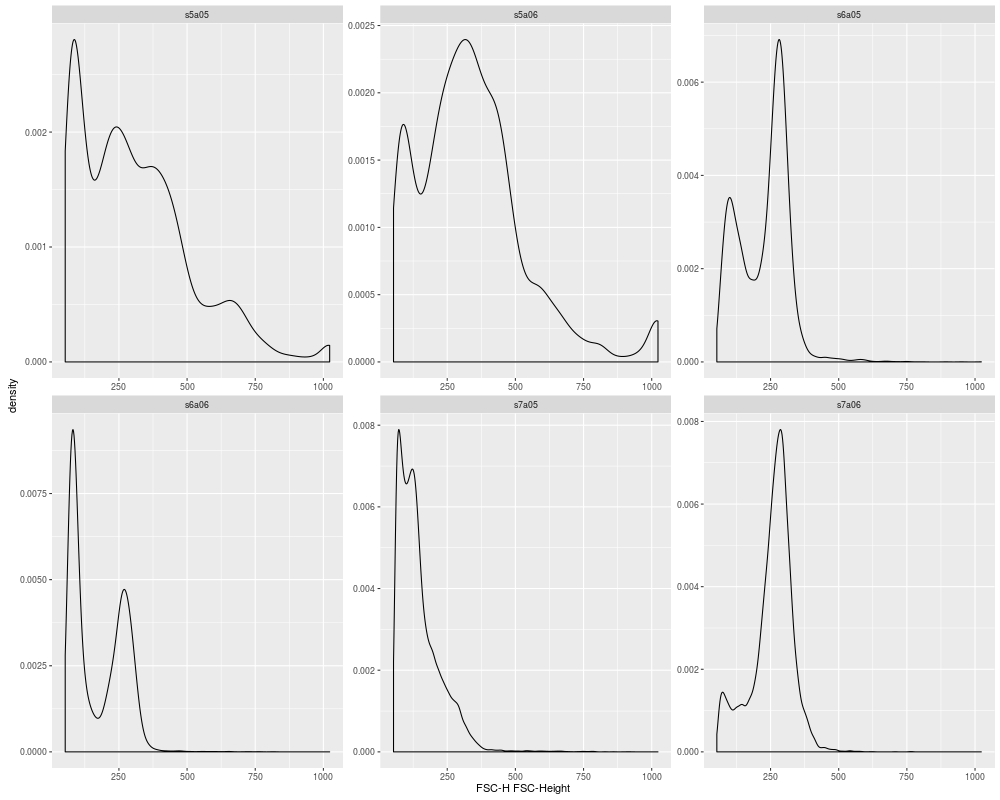
#display density
p + geom_density()
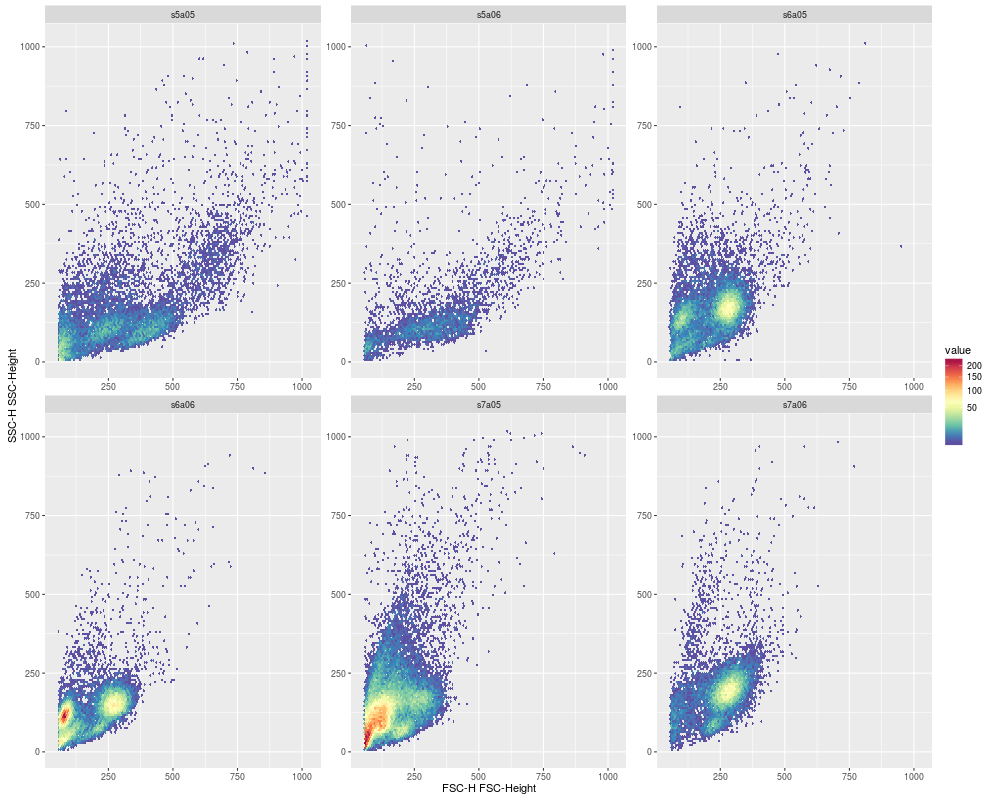
# 2d scatter/dot plot
p <- ggcyto(fs, aes(x = `FSC-H`, y = `SSC-H`))
p <- p + geom_hex(bins = 128)
p
Results
R version 3.3.1 (2016-06-21) -- "Bug in Your Hair"
Copyright (C) 2016 The R Foundation for Statistical Computing
Platform: x86_64-pc-linux-gnu (64-bit)

R is free software and comes with ABSOLUTELY NO WARRANTY.
You are welcome to redistribute it under certain conditions.
Type 'license()' or 'licence()' for distribution details.

R is a collaborative project with many contributors.
Type 'contributors()' for more information and
'citation()' on how to cite R or R packages in publications.

Type 'demo()' for some demos, 'help()' for on-line help, or
'help.start()' for an HTML browser interface to help.
Type 'q()' to quit R.

> library(ggcyto)
Loading required package: ggplot2
Loading required package: flowCore
Loading required package: ncdfFlow
Loading required package: flowViz
Loading required package: lattice
Loading required package: RcppArmadillo
Loading required package: BH
Loading required package: flowWorkspace
Loading required package: gridExtra
> png(filename="/home/ddbj/snapshot/RGM3/R_BC/result/ggcyto/ggcyto.flowSet.Rd_%03d_medium.png", width=480, height=480)
> ### Name: ggcyto.flowSet
> ### Title: Create a new ggcyto plot from a flowSet
> ### Aliases: ggcyto.flowSet
>
> ### ** Examples
>
> data(GvHD)
> fs <- GvHD[subset(pData(GvHD), Patient %in%5:7 & Visit %in% c(5:6))[["name"]]]
> # 1d histogram/densityplot
> p <- ggcyto(fs, aes(x = `FSC-H`))
> #facet_wrap(~name)` is used automatically
> p1 <- p + geom_histogram()
> p1
`stat_bin()` using `bins = 30`. Pick better value with `binwidth`.
Warning message:
Removed 6 rows containing missing values (geom_bar).
> #overwriting the default faceeting
> p1 + facet_grid(Patient~Visit)
`stat_bin()` using `bins = 30`. Pick better value with `binwidth`.
Warning message:
Removed 6 rows containing missing values (geom_bar).
>
> #display density
> p + geom_density()
>
> # 2d scatter/dot plot
> p <- ggcyto(fs, aes(x = `FSC-H`, y =  `SSC-H`))
> p <- p + geom_hex(bins = 128)
> p
Warning message:
Removed 257 rows containing missing values (geom_hex).
>
>
>
>
>
> dev.off()
null device
          1
>
 .
.