Supported by Dr. Osamu Ogasawara and  . . |
|
Last data update: 2014.03.03 |
Class 'AlignedGenomeIntervals'DescriptionA class for representing reads from next-generation sequencing experiments that have been aligned to genomic intervals. Objects from the ClassObjects can be created either by:
Slots
ExtendsClass Methods
Author(s)Joern Toedling See Also
Examples
############# toy example:
A <- new("AlignedGenomeIntervals",
.Data=cbind(c(1,3,4,5,8,10), c(5,5,6,8,9,11)),
annotation=data.frame(
seq_name=factor(rep(c("chr1","chr2","chr3"), each=2)),
strand=factor(c("-","-","+","+","+","+") ,levels=c("-","+")),
inter_base=rep(FALSE, 6)),
reads=rep(3L, 6), matches=rep(1L,6),
sequence=c("ACATT","ACA","CGT","GTAA","AG","CT"))
show(A)
detail(A)
## alternative initiation of this object:
A <- AlignedGenomeIntervals(
start=c(1,3,4,5,8,10), end=c(5,5,6,8,9,11),
chromosome=rep(c("chr2","chrX","chr1"), each=2),
strand=c("-","-","+","+","+","+"),
sequence=c("ACATT","ACA","CGT","GGAA","AG","CT"),
reads=c(1L, 5L, 2L, 7L, 3L, 3L))
detail(A)
## custom identifiers can be assigned to the intervals
id(A) <- paste("gi", 1:6, sep="")
## subsetting and combining
detail(A[c(1:4)])
detail(c(A[1], A[4]))
## sorting: always useful
A <- sort(A)
detail(A)
## the 'reduce' method provides a cleaned-up, compact set
detail(reduce(A))
## with arguments specifying additional conditions for merging
detail(reduce(A, min.frac=0.8))
## 'sample' to draw a sample subset of reads and their intervals
detail(sample(A, 10))
## biological example
exDir <- system.file("extdata", package="girafe")
exA <- readAligned(dirPath=exDir, type="Bowtie",
pattern="aravinSRNA_23_no_adapter_excerpt_mm9_unmasked.bwtmap")
exAI <- as(exA, "AlignedGenomeIntervals")
organism(exAI) <- "Mm"
show(exAI)
## which chromosomes are the intervals on?
table(chromosome(exAI))
## subset
exAI[is.element(chromosome(exAI), c("chr1","chr2"))]
## compute coverage per chromosome:
coverage(exAI[is.element(chromosome(exAI), c("chr1","chr2"))])
### plotting:
load(file.path(exDir, "mgi_gi.RData"))
if (interactive())
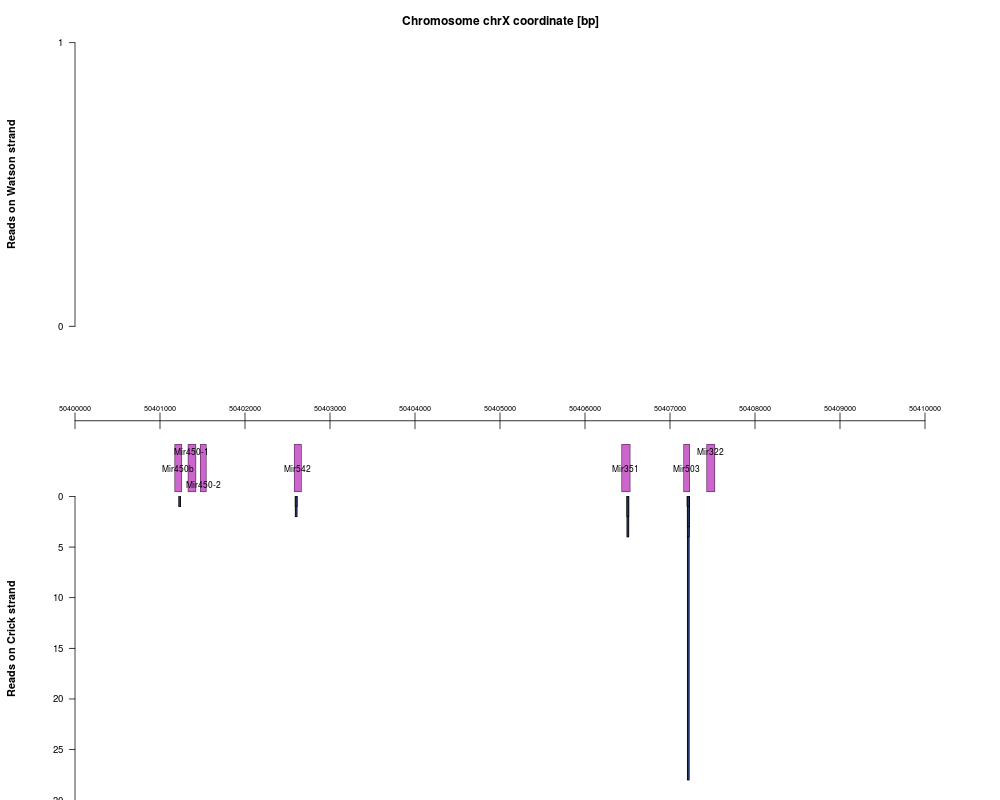
plot(exAI, mgi.gi, chr="chrX", start=50400000, end=50410000)
### overlap with annotated genome elements:
exOv <- interval_overlap(exAI, mgi.gi)
## how many elements do read match positions generally overlap:
table(listLen(exOv))
## what are the 13 elements overlapped by a single match position:
mgi.gi[exOv[[which.max(listLen(exOv))]]]
## what kinds of elements are overlapped
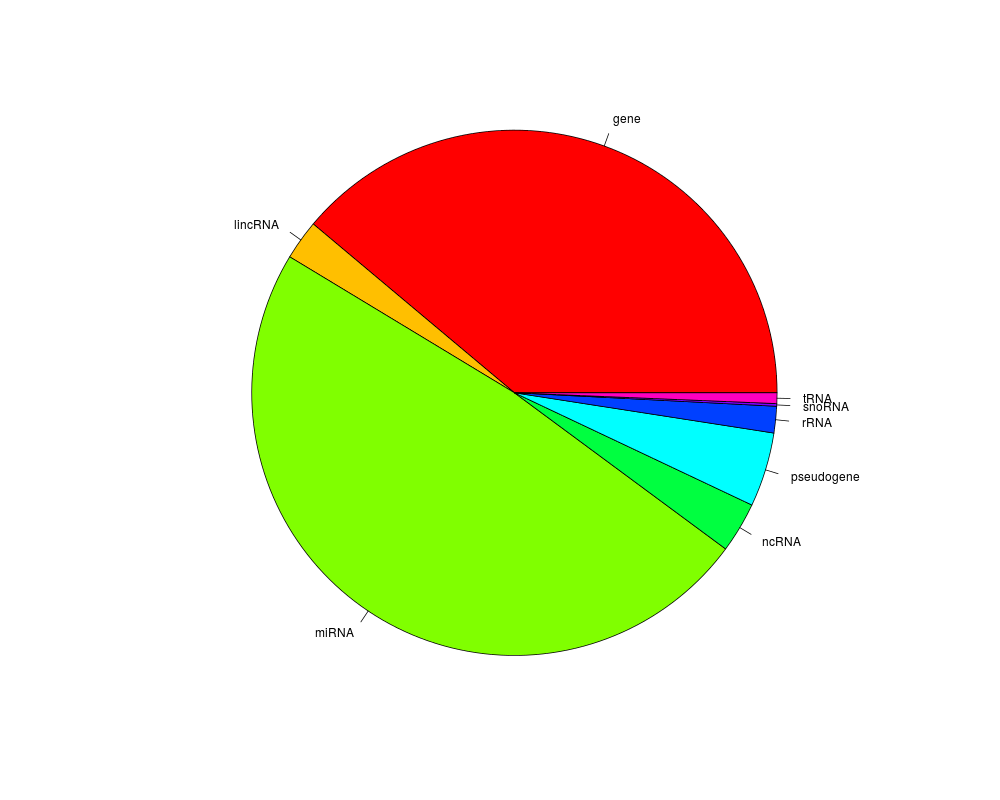
(tabOv <- table(as.character(mgi.gi$type)[unlist(exOv)]))
### display those classes:
my.cols <- rainbow(length(tabOv))
if (interactive())
pie(tabOv, col=my.cols, radius=0.85)
Results
R version 3.3.1 (2016-06-21) -- "Bug in Your Hair"
Copyright (C) 2016 The R Foundation for Statistical Computing
Platform: x86_64-pc-linux-gnu (64-bit)

R is free software and comes with ABSOLUTELY NO WARRANTY.
You are welcome to redistribute it under certain conditions.
Type 'license()' or 'licence()' for distribution details.

R is a collaborative project with many contributors.
Type 'contributors()' for more information and
'citation()' on how to cite R or R packages in publications.

Type 'demo()' for some demos, 'help()' for on-line help, or
'help.start()' for an HTML browser interface to help.
Type 'q()' to quit R.

> library(girafe)
Loading required package: BiocGenerics
Loading required package: parallel

Attaching package: 'BiocGenerics'

The following objects are masked from 'package:parallel':

    clusterApply, clusterApplyLB, clusterCall, clusterEvalQ,
    clusterExport, clusterMap, parApply, parCapply, parLapply,
    parLapplyLB, parRapply, parSapply, parSapplyLB

The following objects are masked from 'package:stats':

    IQR, mad, xtabs

The following objects are masked from 'package:base':

    Filter, Find, Map, Position, Reduce, anyDuplicated, append,
    as.data.frame, cbind, colnames, do.call, duplicated, eval, evalq,
    get, grep, grepl, intersect, is.unsorted, lapply, lengths, mapply,
    match, mget, order, paste, pmax, pmax.int, pmin, pmin.int, rank,
    rbind, rownames, sapply, setdiff, sort, table, tapply, union,
    unique, unsplit

Loading required package: S4Vectors
Loading required package: stats4

Attaching package: 'S4Vectors'

The following objects are masked from 'package:base':

    colMeans, colSums, expand.grid, rowMeans, rowSums

Loading required package: Rsamtools
Loading required package: GenomeInfoDb
Loading required package: IRanges
Loading required package: GenomicRanges
Loading required package: Biostrings
Loading required package: XVector
Loading required package: intervals

Attaching package: 'intervals'

The following object is masked from 'package:Biostrings':

    type

The following object is masked from 'package:GenomicRanges':

    reduce

The following object is masked from 'package:IRanges':

    reduce

The following object is masked from 'package:S4Vectors':

    expand

Loading required package: ShortRead
Loading required package: BiocParallel
Loading required package: GenomicAlignments
Loading required package: SummarizedExperiment
Loading required package: Biobase
Welcome to Bioconductor

    Vignettes contain introductory material; view with
    'browseVignettes()'. To cite Bioconductor, see
    'citation("Biobase")', and for packages 'citation("pkgname")'.

Loading required package: genomeIntervals
Loading required package: grid
No methods found in "IRanges" for requests: sort
> png(filename="/home/ddbj/snapshot/RGM3/R_BC/result/girafe/AlignedGenomeIntervals-class.Rd_%03d_medium.png", width=480, height=480)
> ### Name: AlignedGenomeIntervals-class
> ### Title: Class 'AlignedGenomeIntervals'
> ### Aliases: AlignedGenomeIntervals-class AlignedGenomeIntervals
> ###   [,AlignedGenomeIntervals,ANY,ANY-method c.AlignedGenomeIntervals
> ###   c,AlignedGenomeIntervals-method chrlengths
> ###   chrlengths,AlignedGenomeIntervals-method chrlengths<-
> ###   chrlengths<-,AlignedGenomeIntervals,numeric-method
> ###   clusters,AlignedGenomeIntervals-method
> ###   clusters,Genome_intervals-method
> ###   coerce,AlignedRead,AlignedGenomeIntervals-method
> ###   coerce,AlignedGenomeIntervals,RangedData-method
> ###   coverage,AlignedGenomeIntervals-method
> ###   detail,AlignedGenomeIntervals-method export
> ###   export,AlignedGenomeIntervals,character,character-method
> ###   export,Genome_intervals,character,ANY-method extend
> ###   extend,AlignedGenomeIntervals-method
> ###   extend,Genome_intervals_stranded-method
> ###   extend,Genome_intervals-method id,AlignedGenomeIntervals-method id<-
> ###   id<-,AlignedGenomeIntervals,character-method
> ###   hist,AlignedGenomeIntervals-method
> ###   interval_included,AlignedGenomeIntervals,Genome_intervals_stranded-method
> ###   interval_included,Genome_intervals_stranded,AlignedGenomeIntervals-method
> ###   interval_included,AlignedGenomeIntervals,AlignedGenomeIntervals-method
> ###   interval_overlap,AlignedGenomeIntervals,Genome_intervals-method
> ###   interval_overlap,Genome_intervals,AlignedGenomeIntervals-method
> ###   interval_overlap,AlignedGenomeIntervals,Genome_intervals_stranded-method
> ###   interval_overlap,Genome_intervals_stranded,AlignedGenomeIntervals-method
> ###   interval_overlap,AlignedGenomeIntervals,AlignedGenomeIntervals-method
> ###   matches matches,AlignedGenomeIntervals-method matches<-
> ###   matches<-,AlignedGenomeIntervals,integer-method
> ###   nchar,AlignedGenomeIntervals-method organism
> ###   organism,AlignedGenomeIntervals-method organism<-
> ###   organism<-,AlignedGenomeIntervals-method
> ###   organism<-,AlignedGenomeIntervals,character-method
> ###   plot,AlignedGenomeIntervals-method
> ###   plot,AlignedGenomeIntervals,ANY-method
> ###   plot,AlignedGenomeIntervals,missing-method
> ###   plot,AlignedGenomeIntervals,Genome_intervals_stranded-method reads
> ###   reads,AlignedGenomeIntervals-method reads<-
> ###   reads<-,AlignedGenomeIntervals,character-method
> ###   reduce,AlignedGenomeIntervals-method reduce,Genome_intervals-method
> ###   sample,AlignedGenomeIntervals-method
> ###   score,AlignedGenomeIntervals-method
> ###   score<-,AlignedGenomeIntervals,numeric-method
> ###   score<-,AlignedGenomeIntervals-method score<- seqnames
> ###   seqnames,AlignedGenomeIntervals-method
> ###   show,AlignedGenomeIntervals-method sort,AlignedGenomeIntervals-method
> ###   strand,AlignedGenomeIntervals-method
> ###   strand<-,AlignedGenomeIntervals,vector-method
> ###   strand<-,AlignedGenomeIntervals,factor-method subset
> ###   subset,AlignedGenomeIntervals-method summary
> ###   summary,AlignedGenomeIntervals-method
> ###   width,AlignedGenomeIntervals-method
> ###   chromosome,AlignedGenomeIntervals-method
> ###   chromosome,Genome_intervals-method
> ### Keywords: classes
>
> ### ** Examples
>
>   ############# toy example:
>   A <- new("AlignedGenomeIntervals",
+          .Data=cbind(c(1,3,4,5,8,10), c(5,5,6,8,9,11)),
+          annotation=data.frame(
+            seq_name=factor(rep(c("chr1","chr2","chr3"), each=2)),
+            strand=factor(c("-","-","+","+","+","+") ,levels=c("-","+")),
+            inter_base=rep(FALSE, 6)),
+          reads=rep(3L, 6), matches=rep(1L,6),
+          sequence=c("ACATT","ACA","CGT","GTAA","AG","CT"))
>
>   show(A)
6 genome intervals with 18 aligned reads on 3 chromosome(s).
>   detail(A)
  start end seq_name strand reads matches sequence
1     1   5     chr1      -     3       1    ACATT
2     3   5     chr1      -     3       1      ACA
3     4   6     chr2      +     3       1      CGT
4     5   8     chr2      +     3       1     GTAA
5     8   9     chr3      +     3       1       AG
6    10  11     chr3      +     3       1       CT
>
>   ## alternative initiation of this object:
>   A <- AlignedGenomeIntervals(
+      start=c(1,3,4,5,8,10), end=c(5,5,6,8,9,11),
+      chromosome=rep(c("chr2","chrX","chr1"), each=2),
+      strand=c("-","-","+","+","+","+"),
+      sequence=c("ACATT","ACA","CGT","GGAA","AG","CT"),
+      reads=c(1L, 5L, 2L, 7L, 3L, 3L))
>   detail(A)
  start end seq_name strand reads matches sequence
1     1   5     chr2      -     1       1    ACATT
2     3   5     chr2      -     5       1      ACA
3     4   6     chrX      +     2       1      CGT
4     5   8     chrX      +     7       1     GGAA
5     8   9     chr1      +     3       1       AG
6    10  11     chr1      +     3       1       CT
>
>   ## custom identifiers can be assigned to the intervals
>   id(A) <- paste("gi", 1:6, sep="")
>
>   ## subsetting and combining
>   detail(A[c(1:4)])
  start end seq_name strand reads matches sequence  id
1     1   5     chr2      -     1       1    ACATT gi1
2     3   5     chr2      -     5       1      ACA gi2
3     4   6     chrX      +     2       1      CGT gi3
4     5   8     chrX      +     7       1     GGAA gi4
>   detail(c(A[1], A[4]))
[[1]]
1 genome intervals with 7 aligned reads on 3 chromosome(s).

>
>   ## sorting: always useful
>   A <- sort(A)
>   detail(A)
  start end seq_name strand reads matches sequence  id
1     8   9     chr1      +     3       1       AG gi5
2    10  11     chr1      +     3       1       CT gi6
3     1   5     chr2      -     1       1    ACATT gi1
4     3   5     chr2      -     5       1      ACA gi2
5     4   6     chrX      +     2       1      CGT gi3
6     5   8     chrX      +     7       1     GGAA gi4
>
>   ## the 'reduce' method provides a cleaned-up, compact set
>   detail(reduce(A))
  start end seq_name strand reads matches sequence      id
1     8  11     chr1      +     6       1     AGCT gi5,gi6
2     1   5     chr2      -     6       1    ACATT gi1,gi2
3     4   8     chrX      +     9       1    CGGAA gi3,gi4
>   ##  with arguments specifying additional conditions for merging
>   detail(reduce(A, min.frac=0.8))
  start end seq_name strand reads matches sequence      id
1     8   9     chr1      +     3       1       AG     gi5
2    10  11     chr1      +     3       1       CT     gi6
3     1   5     chr2      -     6       1    ACATT gi1,gi2
4     4   6     chrX      +     2       1      CGT     gi3
5     5   8     chrX      +     7       1     GGAA     gi4
>
>   ## 'sample' to draw a sample subset of reads and their intervals
>   detail(sample(A, 10))
  start end seq_name strand reads matches sequence  id
1     8   9     chr1      +     2       1       AG gi5
2    10  11     chr1      +     2       1       CT gi6
3     3   5     chr2      -     4       1      ACA gi2
4     5   8     chrX      +     2       1     GGAA gi4
>
>   ## biological example
>   exDir <- system.file("extdata", package="girafe")
>   exA   <- readAligned(dirPath=exDir, type="Bowtie",
+     pattern="aravinSRNA_23_no_adapter_excerpt_mm9_unmasked.bwtmap")
>   exAI <- as(exA, "AlignedGenomeIntervals")
>   organism(exAI) <- "Mm"
Loading required package: org.Mm.eg.db
Loading required package: AnnotationDbi

>   show(exAI)
1,286 genome intervals with 1,689 aligned reads on 22 chromosome(s).
Organism: Mm
>   ## which chromosomes are the intervals on?
>   table(chromosome(exAI))

 chr1 chr10 chr11 chr12 chr13 chr14 chr15 chr16 chr17 chr18 chr19  chr2  chr3
  112    50    60    53    65    74    59    48    47    43    19    87    62
 chr4  chr5  chr6  chr7  chr8  chr9 chrMT  chrX  chrY
   57    52    82    51    57    69     5   132     2
>
>   ## subset
>   exAI[is.element(chromosome(exAI),  c("chr1","chr2"))]
199 genome intervals with 245 aligned reads on 22 chromosome(s).
Organism: Mm
>
>   ## compute coverage per chromosome:
>   coverage(exAI[is.element(chromosome(exAI),  c("chr1","chr2"))])
RleList of length 2
$chr1
integer-Rle of length 195471971 with 197 runs
  Lengths:  5632955       23   481869       23 ...  4394657       23    12859
  Values :        0        1        0        1 ...        0        1        0

$chr2
integer-Rle of length 182113224 with 143 runs
  Lengths:  3772451       23   982533       23 ...      473       23  8020148
  Values :        0        2        0        1 ...        0        1        0

>
>   ### plotting:
>   load(file.path(exDir, "mgi_gi.RData"))
> #  if (interactive())
>      plot(exAI, mgi.gi, chr="chrX", start=50400000, end=50410000)
>
>   ### overlap with annotated genome elements:
>   exOv <- interval_overlap(exAI, mgi.gi)
>   ## how many elements do read match positions generally overlap:
>   table(listLen(exOv))

  0   1   2  12
815 340 130   1
>   ## what are the 13 elements overlapped by a single match position:
>   mgi.gi[exOv[[which.max(listLen(exOv))]]]
Object of class Genome_intervals_stranded
12 base intervals and 0 inter-base intervals(*):
chr18 + [37089939, 37347311]
chr18 + [37098972, 37347311]
chr18 + [37105861, 37347311]
chr18 + [37112343, 37347311]
... 4 other intervals...
chr18 + [37157534, 37347311]
chr18 + [37164974, 37347311]
chr18 + [37170512, 37347311]
chr18 + [37179884, 37347311]

annotation:
      seq_name inter_base source type
30726    chr18      FALSE    MGI gene
30727    chr18      FALSE    MGI gene
30728    chr18      FALSE    MGI gene
30729    chr18      FALSE    MGI gene
                                        gffAttributes     ID strand
30726 ACC="MGI:2150982"; Name="protocadherin alpha 1" Pcdha1      +
30727 ACC="MGI:2681880"; Name="protocadherin alpha 2" Pcdha2      +
30728 ACC="MGI:2447313"; Name="protocadherin alpha 3" Pcdha3      +
30729 ACC="MGI:1298406"; Name="protocadherin alpha 4" Pcdha4      +
... 4 other intervals...
      seq_name inter_base source type
30734    chr18      FALSE    MGI gene
30735    chr18      FALSE    MGI gene
30736    chr18      FALSE    MGI gene
30738    chr18      FALSE    MGI gene
                                         gffAttributes      ID strand
30734  ACC="MGI:2447322"; Name="protocadherin alpha 9"  Pcdha9      +
30735 ACC="MGI:1298408"; Name="protocadherin alpha 10" Pcdha10      +
30736 ACC="MGI:1298372"; Name="protocadherin alpha 11" Pcdha11      +
30738 ACC="MGI:1298370"; Name="protocadherin alpha 12" Pcdha12      +
>   ## what kinds of elements are overlapped
>   (tabOv <- table(as.character(mgi.gi$type)[unlist(exOv)]))

      gene    lincRNA      miRNA      ncRNA pseudogene       rRNA     snoRNA
       238         15        297         19         28         10          1
      tRNA
         4
>   ### display those classes:
>   my.cols <- rainbow(length(tabOv))
> #  if (interactive())
>      pie(tabOv, col=my.cols, radius=0.85)
>
>
>
>
>
> dev.off()
null device
          1
>
|