Supported by Dr. Osamu Ogasawara and  . . |
|
Last data update: 2014.03.03 |
Sum up aligned reads per category of genome featureDescriptionA function to sum up aligned reads per category of genome feature (i.e. gene, ncRNA, etc.). Usage
countReadsAnnotated(GI, M, typeColumn="type", fractionGI=0.7,
                    mem.friendly=FALSE, showAllTypes=FALSE)
Arguments
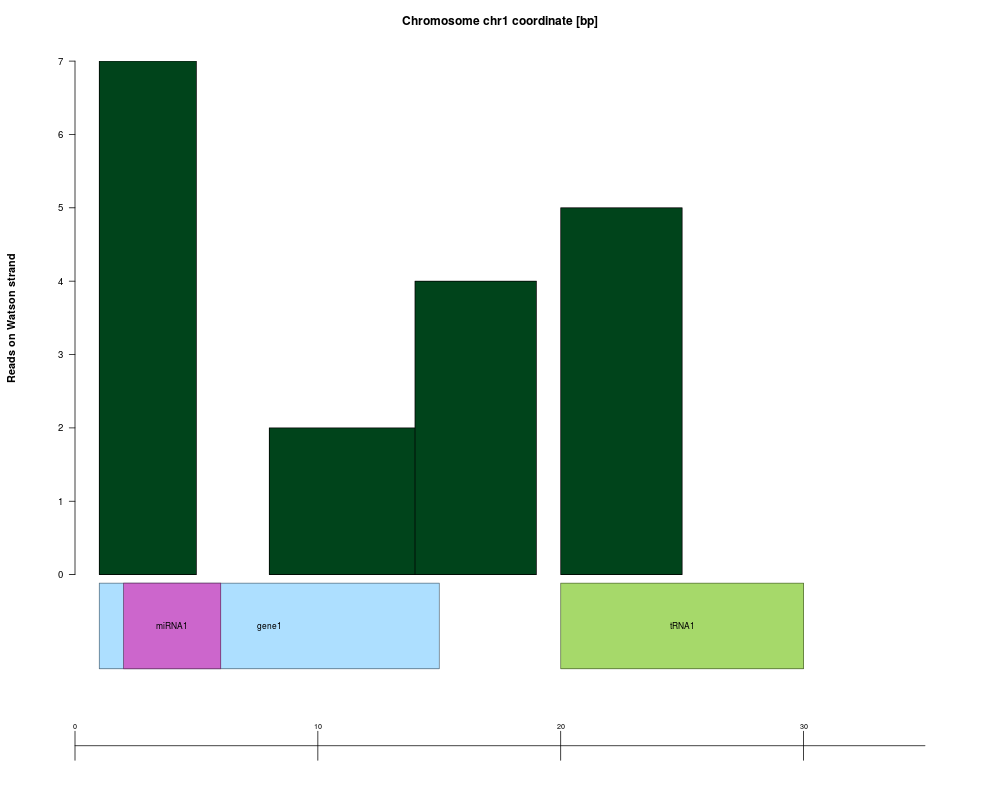
DetailsThe read counts are summed up over each type of genome feature, and the read counts are normalised by their number of genomic matches. For example if a read has two matches in the genome, but only one inside a miRNA, it would count 0.5 for miRNAs. ValueA named numeric vector which gives the summed read counts for each supplied type of genome feature. Author(s)J Toedling Examples
  A <- AlignedGenomeIntervals(
           start=c(1,8,14,20), end=c(5,15,19,25),
           chromosome=rep("chr1", each=4),
           strand=c("+","+","+","+"),
           sequence=c("ACATT","TATCGGAC","TCGGACT","GTAACG"),
           reads=c(7L, 2L, 4L, 5L) )
  M2 <- new("Genome_intervals_stranded",
            rbind(c(2,6), c(1,15), c(20,30)),
            closed = matrix(TRUE, ncol=2, nrow=3),
            annotation = data.frame(
              seq_name= factor(rep("chr1", 3)),
              inter_base= logical(3),
              strand=factor(rep("+", 3), levels=c("+","-")),
              alias=c("miRNA1","gene1","tRNA1"),
              type=c("miRNA","gene","tRNA")) )
  if (interactive()){
     grid.newpage()
     plot(A, M2, chr="chr1", start=0, end=35,
          nameColum="alias", show="plus")
  }
  countReadsAnnotated(A, M2, typeColumn="type")
Results
R version 3.3.1 (2016-06-21) -- "Bug in Your Hair"
Copyright (C) 2016 The R Foundation for Statistical Computing
Platform: x86_64-pc-linux-gnu (64-bit)

R is free software and comes with ABSOLUTELY NO WARRANTY.
You are welcome to redistribute it under certain conditions.
Type 'license()' or 'licence()' for distribution details.

R is a collaborative project with many contributors.
Type 'contributors()' for more information and
'citation()' on how to cite R or R packages in publications.

Type 'demo()' for some demos, 'help()' for on-line help, or
'help.start()' for an HTML browser interface to help.
Type 'q()' to quit R.

> library(girafe)
Loading required package: BiocGenerics
Loading required package: parallel

Attaching package: 'BiocGenerics'

The following objects are masked from 'package:parallel':

    clusterApply, clusterApplyLB, clusterCall, clusterEvalQ,
    clusterExport, clusterMap, parApply, parCapply, parLapply,
    parLapplyLB, parRapply, parSapply, parSapplyLB

The following objects are masked from 'package:stats':

    IQR, mad, xtabs

The following objects are masked from 'package:base':

    Filter, Find, Map, Position, Reduce, anyDuplicated, append,
    as.data.frame, cbind, colnames, do.call, duplicated, eval, evalq,
    get, grep, grepl, intersect, is.unsorted, lapply, lengths, mapply,
    match, mget, order, paste, pmax, pmax.int, pmin, pmin.int, rank,
    rbind, rownames, sapply, setdiff, sort, table, tapply, union,
    unique, unsplit

Loading required package: S4Vectors
Loading required package: stats4

Attaching package: 'S4Vectors'

The following objects are masked from 'package:base':

    colMeans, colSums, expand.grid, rowMeans, rowSums

Loading required package: Rsamtools
Loading required package: GenomeInfoDb
Loading required package: IRanges
Loading required package: GenomicRanges
Loading required package: Biostrings
Loading required package: XVector
Loading required package: intervals

Attaching package: 'intervals'

The following object is masked from 'package:Biostrings':

    type

The following object is masked from 'package:GenomicRanges':

    reduce

The following object is masked from 'package:IRanges':

    reduce

The following object is masked from 'package:S4Vectors':

    expand

Loading required package: ShortRead
Loading required package: BiocParallel
Loading required package: GenomicAlignments
Loading required package: SummarizedExperiment
Loading required package: Biobase
Welcome to Bioconductor

    Vignettes contain introductory material; view with
    'browseVignettes()'. To cite Bioconductor, see
    'citation("Biobase")', and for packages 'citation("pkgname")'.

Loading required package: genomeIntervals
Loading required package: grid
No methods found in "IRanges" for requests: sort
> png(filename="/home/ddbj/snapshot/RGM3/R_BC/result/girafe/countReadsAnnotated.Rd_%03d_medium.png", width=480, height=480)
> ### Name: countReadsAnnotated
> ### Title: Sum up aligned reads per category of genome feature
> ### Aliases: countReadsAnnotated
> ### Keywords: manip
>
> ### ** Examples
>
>   A <- AlignedGenomeIntervals(
+            start=c(1,8,14,20), end=c(5,15,19,25),
+            chromosome=rep("chr1", each=4),
+            strand=c("+","+","+","+"),
+            sequence=c("ACATT","TATCGGAC","TCGGACT","GTAACG"),
+            reads=c(7L, 2L, 4L, 5L) )
>   M2 <- new("Genome_intervals_stranded",
+             rbind(c(2,6), c(1,15), c(20,30)),
+             closed = matrix(TRUE, ncol=2, nrow=3),
+             annotation = data.frame(
+               seq_name= factor(rep("chr1", 3)),
+               inter_base= logical(3),
+               strand=factor(rep("+", 3), levels=c("+","-")),
+               alias=c("miRNA1","gene1","tRNA1"),
+               type=c("miRNA","gene","tRNA")) )
> #  if (interactive()){
>      grid.newpage()
>      plot(A, M2, chr="chr1", start=0, end=35,
+           nameColum="alias", show="plus")
> #  }
>   countReadsAnnotated(A, M2, typeColumn="type")
      miRNA        tRNA        gene unannotated
          7           5           2           4
>
>
>
>
>
> dev.off()
null device
          1
>
|