Supported by Dr. Osamu Ogasawara and  . . |
|
Last data update: 2014.03.03 |
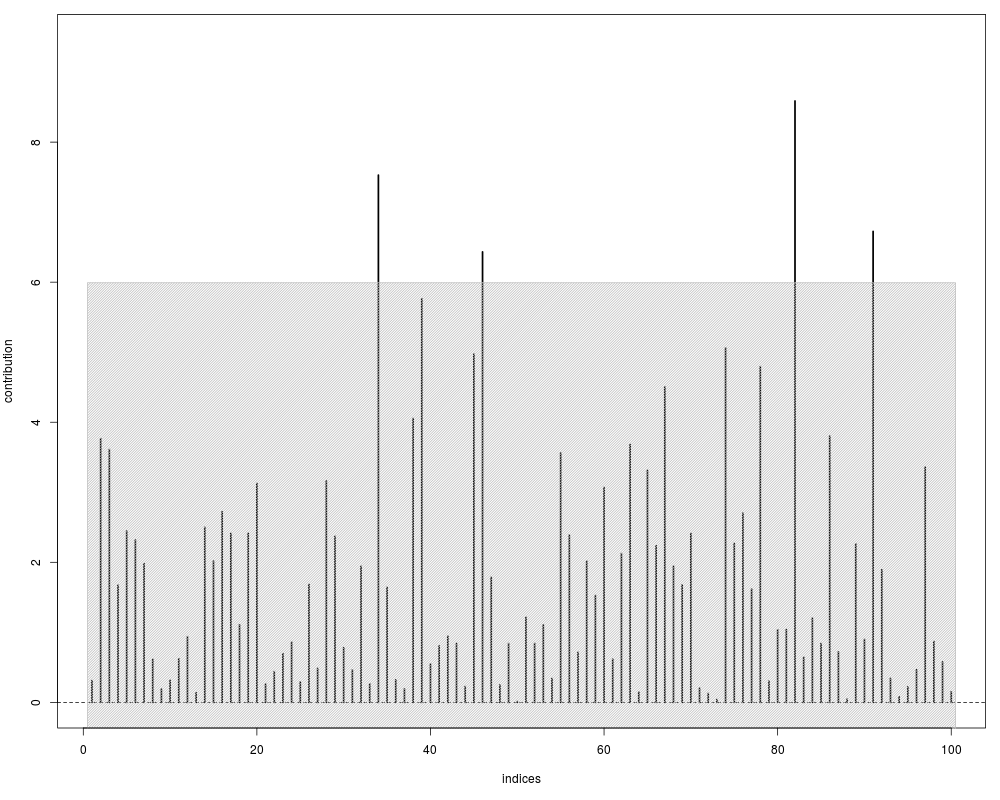
Internal functionDescriptionThis function plots the individual contributions
to the test statistic.
It is called by the function Usageintern.plot(u, upper = NULL, xlab = "indices") Arguments
ValueThe function plots the arguments. ReferencesA Rauschenberger, MA Jonker, MA van de Wiel, and RX Menezes (2016). "Testing for association between RNA-Seq and high-dimensional data", BMC Bioinformatics. 17:118. html pdf (open access) See AlsoThis is an Examples# simulate influences set.seed(1) u <- rchisq(n=100,df=2) # influence plot upper <- rep(qchisq(p=0.95,df=2),times=100) intern.plot(u,upper) Results
R version 3.3.1 (2016-06-21) -- "Bug in Your Hair"
Copyright (C) 2016 The R Foundation for Statistical Computing
Platform: x86_64-pc-linux-gnu (64-bit)

R is free software and comes with ABSOLUTELY NO WARRANTY.
You are welcome to redistribute it under certain conditions.
Type 'license()' or 'licence()' for distribution details.

R is a collaborative project with many contributors.
Type 'contributors()' for more information and
'citation()' on how to cite R or R packages in publications.

Type 'demo()' for some demos, 'help()' for on-line help, or
'help.start()' for an HTML browser interface to help.
Type 'q()' to quit R.

> library(globalSeq)
> png(filename="/home/ddbj/snapshot/RGM3/R_BC/result/globalSeq/intern.plot.Rd_%03d_medium.png", width=480, height=480)
> ### Name: intern.plot
> ### Title: Internal function
> ### Aliases: intern.plot
> ### Keywords: misc
>
> ### ** Examples
>
>
> # simulate influences
> set.seed(1)
> u <- rchisq(n=100,df=2)
>
> # influence plot
> upper <- rep(qchisq(p=0.95,df=2),times=100)
> intern.plot(u,upper)
>
>
>
>
>
>
> dev.off()
null device
          1
>
|
Created & Maintained by Osamu Ogasawara (osamu.ogasawara@gmail.com) and 