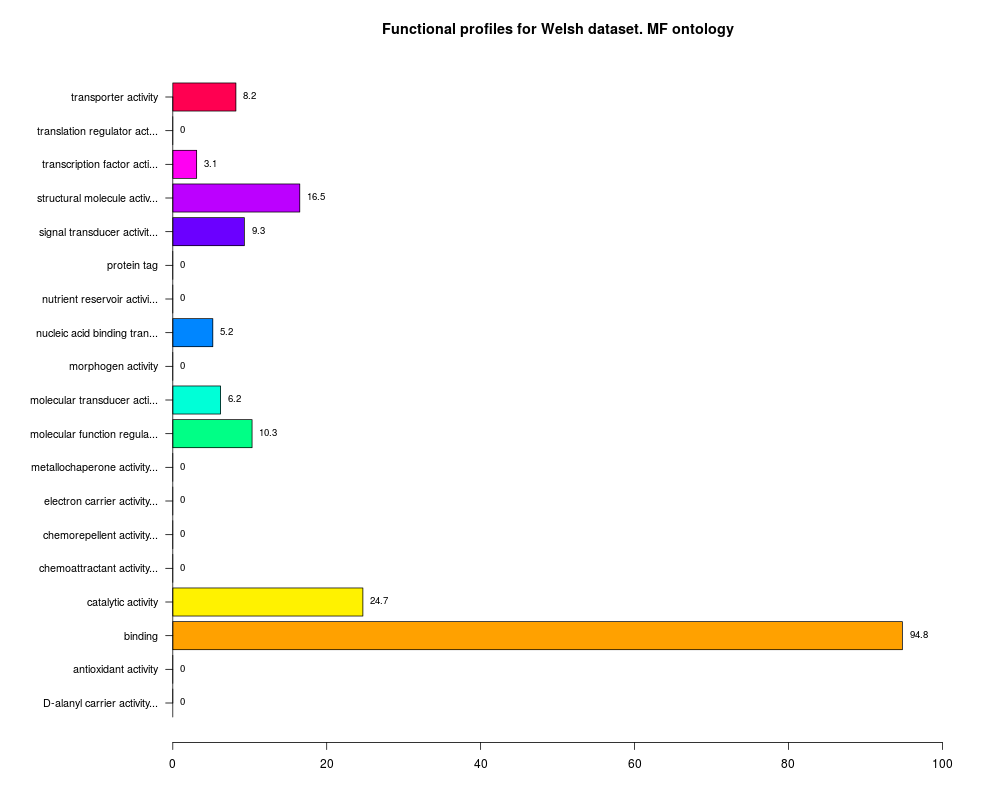
Plots basic functional profiles created with the 'basicProfile' instruction.
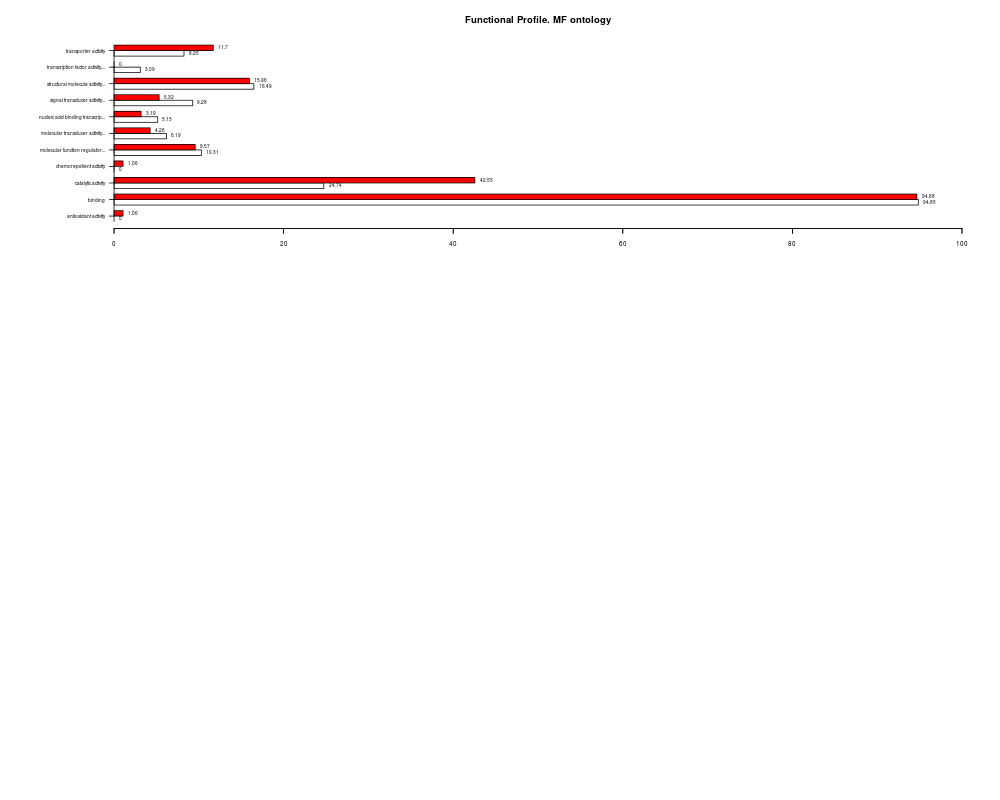
If several profiles have to be plot together they must be first merged using the 'mergeProfiles' function.
The labels of the Y-axis of the plots are the descriptions of the GO Terms. If the label is longer than 20 characters
it is truncated and ended by three dots.
R version 3.3.1 (2016-06-21) -- "Bug in Your Hair"
Copyright (C) 2016 The R Foundation for Statistical Computing
Platform: x86_64-pc-linux-gnu (64-bit)

R is free software and comes with ABSOLUTELY NO WARRANTY.
You are welcome to redistribute it under certain conditions.
Type 'license()' or 'licence()' for distribution details.

R is a collaborative project with many contributors.
Type 'contributors()' for more information and
'citation()' on how to cite R or R packages in publications.

Type 'demo()' for some demos, 'help()' for on-line help, or
'help.start()' for an HTML browser interface to help.
Type 'q()' to quit R.

> library(goProfiles)
Loading required package: Biobase
Loading required package: BiocGenerics
Loading required package: parallel

Attaching package: 'BiocGenerics'

The following objects are masked from 'package:parallel':

    clusterApply, clusterApplyLB, clusterCall, clusterEvalQ,
    clusterExport, clusterMap, parApply, parCapply, parLapply,
    parLapplyLB, parRapply, parSapply, parSapplyLB

The following objects are masked from 'package:stats':

    IQR, mad, xtabs

The following objects are masked from 'package:base':

    Filter, Find, Map, Position, Reduce, anyDuplicated, append,
    as.data.frame, cbind, colnames, do.call, duplicated, eval, evalq,
    get, grep, grepl, intersect, is.unsorted, lapply, lengths, mapply,
    match, mget, order, paste, pmax, pmax.int, pmin, pmin.int, rank,
    rbind, rownames, sapply, setdiff, sort, table, tapply, union,
    unique, unsplit

Welcome to Bioconductor

    Vignettes contain introductory material; view with
    'browseVignettes()'. To cite Bioconductor, see
    'citation("Biobase")', and for packages 'citation("pkgname")'.

Loading required package: AnnotationDbi
Loading required package: stats4
Loading required package: IRanges
Loading required package: S4Vectors

Attaching package: 'S4Vectors'

The following objects are masked from 'package:base':

    colMeans, colSums, expand.grid, rowMeans, rowSums

Loading required package: GO.db

> png(filename="/home/ddbj/snapshot/RGM3/R_BC/result/goProfiles/plotProfiles.Rd_%03d_medium.png", width=480, height=480)
> ### Name: plotProfiles
> ### Title: Plot functional profiles
> ### Aliases: plotProfiles
> ### Keywords: hplot
>
> ### ** Examples
>
> require(goProfiles)
> data(prostateIds)
> welsh.MF <- basicProfile (welsh01EntrezIDs[1:100], onto="MF", level=2, orgPackage="org.Hs.eg.db")

> singh.MF <- basicProfile (singh01EntrezIDs[1:100], onto="MF", level=2, orgPackage="org.Hs.eg.db")
> plotProfiles(welsh.MF,'Functional profiles for Welsh dataset',percentage=TRUE)
> welsh.singh.MF <-mergeProfilesLists(welsh.MF, singh.MF, profNames=c("Welsh", "Singh"))
> plotProfiles(welsh.singh.MF , percentage=TRUE, multiplePlots=TRUE, labelWidth=30)
>
>
>
>
>
> dev.off()
null device
          1
>
 .
.