Supported by Dr. Osamu Ogasawara and  . . |
|
Last data update: 2014.03.03 |
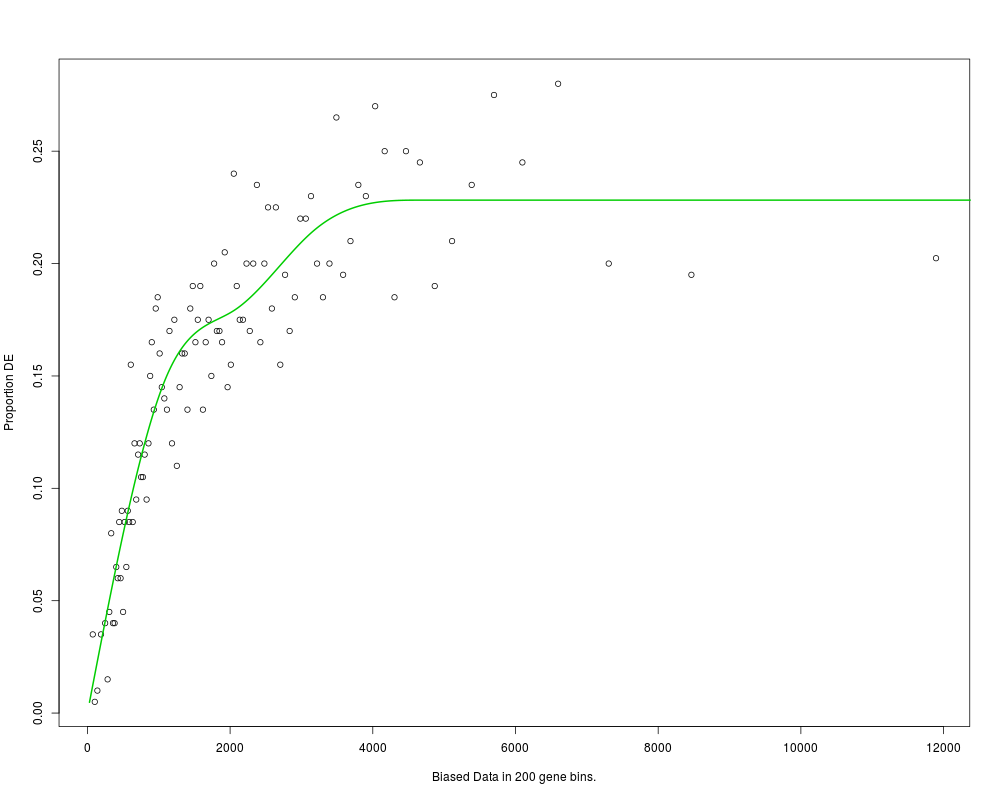
Plot the Probability Weighting FunctionDescriptionPlots the Probability Weighting Function created by UsageplotPWF(pwf,binsize="auto",pwf_col=3,pwf_lwd=2,xlab="Biased Data in <binsize> gene bins.",ylab="Proportion DE",...) Arguments
DetailsThis function is almost always called using the output from the ValueNothing is returned. Author(s)Matthew D. Young myoung@wehi.edu.au ReferencesYoung, M. D., Wakefield, M. J., Smyth, G. K., Oshlack, A. (2010) Gene ontology analysis for RNA-seq: accounting for selection bias Genome Biology Date: Feb 2010 Vol: 11 Issue: 2 Pages: R14 See Also
Examplesdata(genes) pwf <- nullp(genes, 'hg19', 'ensGene',plot.fit=FALSE) plotPWF(pwf,binsize=200) Results
R version 3.3.1 (2016-06-21) -- "Bug in Your Hair"
Copyright (C) 2016 The R Foundation for Statistical Computing
Platform: x86_64-pc-linux-gnu (64-bit)

R is free software and comes with ABSOLUTELY NO WARRANTY.
You are welcome to redistribute it under certain conditions.
Type 'license()' or 'licence()' for distribution details.

R is a collaborative project with many contributors.
Type 'contributors()' for more information and
'citation()' on how to cite R or R packages in publications.

Type 'demo()' for some demos, 'help()' for on-line help, or
'help.start()' for an HTML browser interface to help.
Type 'q()' to quit R.

> library(goseq)
Loading required package: BiasedUrn
Loading required package: geneLenDataBase

> png(filename="/home/ddbj/snapshot/RGM3/R_BC/result/goseq/plotPWF.Rd_%03d_medium.png", width=480, height=480)
> ### Name: plotPWF
> ### Title: Plot the Probability Weighting Function
> ### Aliases: plotPWF
>
> ### ** Examples
>
> data(genes)
> pwf <- nullp(genes, 'hg19', 'ensGene',plot.fit=FALSE)
Loading hg19 length data...
Warning message:
In pcls(G) : initial point very close to some inequality constraints
> plotPWF(pwf,binsize=200)
>
>
>
>
>
> dev.off()
null device
          1
>
|