R: Gaussian process ranking and estimation of gene expression...
gprege
R Documentation
Gaussian process ranking and estimation of gene expression time-series
Description
Fits two GPs with the an RBF (+ noise diagonal) kernel on each profile. One GP kernel is initialised wih a short lengthscale
hyperparameter, signal variance as the observed variance and a zero noise variance. It is optimised via scaled conjugate gradients (netlab). The
other GP has fixed hyperparameters with a zero inverse-width, zero signal variance and noise variance as the observed variance. The log-ratio of
marginal likelihoods of the two hypotheses acts as a score of differential expression for the profile. Comparison via ROC curves is
performed against BATS (Angelini et.al, 2007). See Kalaitzis & Lawrence (2011) for a detailed discussion of the ranking algorithm and dataset used.
Usage
gprege(data, inputs, gpregeOptions)
Arguments
data
The matrix of gene expression profiles; one profile per row.
inputs
Inputs (timepoints) to the GP.
gpregeOptions
Options list for gprege with fields
explore
Logical. TRUE operates in a user interactive mode. Used for examining individual gene expression profiles.
labels
A binary vector. TRUE specifies whether the corresponding profile comes from a differentially expressed gene (usually from a ground truth).
indexRange
A numeric vector. Range of indices of profiles on which the function should operate. Useful for selective exploration of specific profiles, e.g. only genes marked as differentially expressed in a ground truth list.
interpolatedT
A numeric vector. New timepoints to interpolate for each profile, based on the estimated function values.
iters
A scalar. The number of iterations for scaled-conjugate gradients (SCG) optimisation.
display
Logical. Display gradient and LML information on each SCG iteration.
inithypers
The matrix of hyperparameter configurations as its rows. Each row has the following format:
[inverse-lengthscale percent-signal-variance percent-noise-variance]
The first row corresponds to a (practically constant) function with a very large lengthscale. Such a function will account for 0 percent of the observed variance in the expression profile (hence 0 for signal) and explain it as noise (hence 1 for noise). Subsequent rows (initialisations for SCG optimisation) correspond to functions of various lengthscales that explain all the observed variance as signal. A reasonable lengthscale would be roughly in line with the time-point sampling intervals.
exhaustPlotRes
A scalar. The search resolution. Used for interactive mode (explore == 1).
exhaustPlotLevels
A scalar. Number of contour levels in the exhaustive plot. Used for interactive mode (explore == 1).
exhaustPlotMaxWidth
A scalar. the maximum lengthscale to search for. Used for interactive mode (explore == 1).
Value
gpregeOutput
Output list with fields:
signalvar
A numeric vector of the vertical lengthscales of the optimised RBF kernel; one for each profile.
noisevar
A numeric vector. Similar to signalvar, but for the noise hyperparameter.
width
A numeric vector. Similar to signalvar and noisever, but for the horizontal lengthscales of the RBF.
LMLs
A numeric vector of log-marginal likelihoods of the GP; one for each profile.
interpolatedData
A matrix of the extended dataset with interpolated values as the augmenting columns.
rankingScores
A numeric vector of the ranking scores, based on the log-ratio of marginal likelihoods.
R version 3.3.1 (2016-06-21) -- "Bug in Your Hair"
Copyright (C) 2016 The R Foundation for Statistical Computing
Platform: x86_64-pc-linux-gnu (64-bit)
R is free software and comes with ABSOLUTELY NO WARRANTY.
You are welcome to redistribute it under certain conditions.
Type 'license()' or 'licence()' for distribution details.
R is a collaborative project with many contributors.
Type 'contributors()' for more information and
'citation()' on how to cite R or R packages in publications.
Type 'demo()' for some demos, 'help()' for on-line help, or
'help.start()' for an HTML browser interface to help.
Type 'q()' to quit R.
> library(gprege)
Loading required package: gptk
Loading required package: Matrix
Loading required package: fields
Loading required package: spam
Loading required package: grid
Spam version 1.3-0 (2015-10-24) is loaded.
Type 'help( Spam)' or 'demo( spam)' for a short introduction
and overview of this package.
Help for individual functions is also obtained by adding the
suffix '.spam' to the function name, e.g. 'help( chol.spam)'.
Attaching package: 'spam'
The following objects are masked from 'package:base':
backsolve, forwardsolve
Loading required package: maps
# maps v3.1: updated 'world': all lakes moved to separate new #
# 'lakes' database. Type '?world' or 'news(package="maps")'. #
> png(filename="/home/ddbj/snapshot/RGM3/R_BC/result/gprege/gprege.Rd_%03d_medium.png", width=480, height=480)
> ### Name: gprege
> ### Title: Gaussian process ranking and estimation of gene expression
> ### time-series
> ### Aliases: gprege
>
> ### ** Examples
>
> ## see demTp63Gp1.R
> data(FragmentDellaGattaData) ## Load demo data.
> ## Setup other gprege options.
> gpregeOptions = list(indexRange=(1:2), explore=TRUE, exhaustPlotRes=30, exhaustPlotLevels=10,
+ exhaustPlotMaxWidth=100, iters=100, labels=DGatta_labels_byTSNI, display=FALSE)
> ## Matrix of different hyperparameter configurations as rows:
> ## [inverse-lengthscale percent-signal-variance percent-noise-variance].
> gpregeOptions$inithypers <- matrix( c(
+ 1/1000, 1e-3, 0.999
+ ,1/20, 0.999, 1e-3
+ ), ncol=3, byrow=TRUE)
> gpregeOutput <- gprege(data=exprs_tp63_RMA, inputs=matrix(seq(0,240,by=20), ncol=1), gpregeOptions=gpregeOptions)
========================================================
Profile 1 Label: 0
========================================================
Length-scale Signal Noise
84.73945 0.22901 0.03297
Init.le LML Best
32 2.95540268
4 16.69472737 <--
Total st.dev. Estim.sig + noise
0.200493 0.261986
Log-ratio (max(LML[2:end]) - LML[1])
13.73932
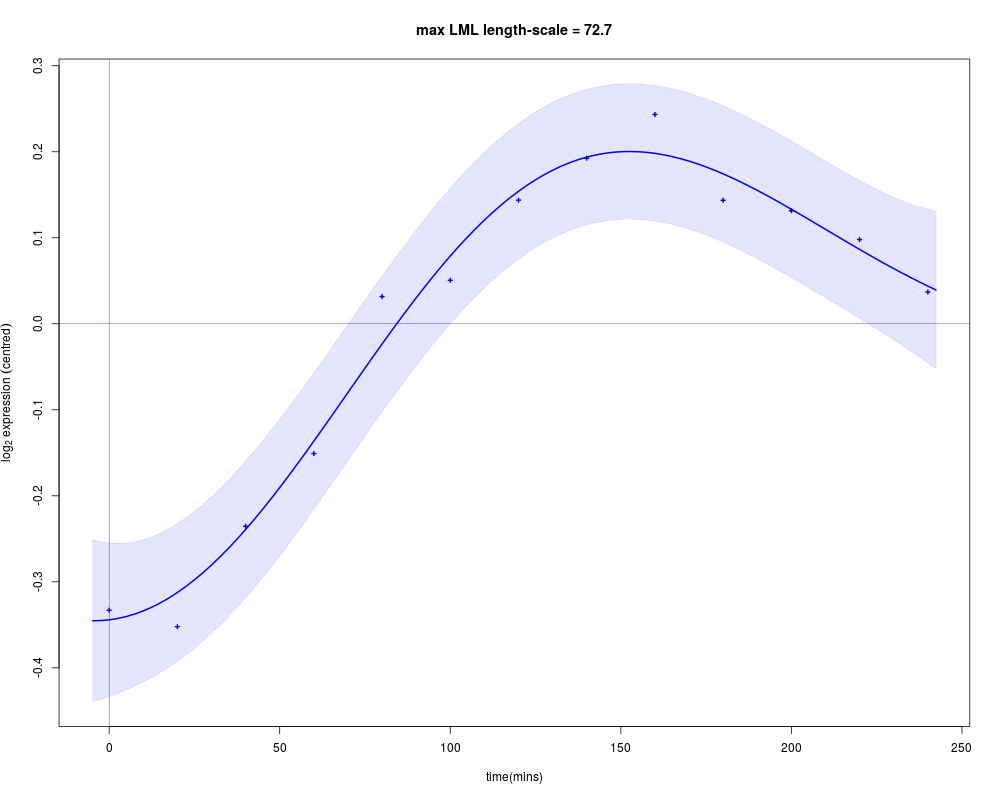
============= EXHAUSTIVE LML SEARCH =====================
Length-scale Signal Noise
72.68966 0.16579 0.03470
Max LML Estim. sig + noise
16.32234561 0.200493
ENTER to continue
========================================================
Profile 2 Label: 0
========================================================
Length-scale Signal Noise
185.38880 0.37661 0.10492
Init.le LML Best
32 0.25444534
4 6.37127488 <--
Total st.dev. Estim.sig + noise
0.246752 0.481528
Log-ratio (max(LML[2:end]) - LML[1])
6.11683
============= EXHAUSTIVE LML SEARCH =====================
Length-scale Signal Noise
62.44828 0.15310 0.09366
Max LML Estim. sig + noise
5.08007151 0.246752
ENTER to continue
>
>
>
>
>
> dev.off()
null device
1
>
 .
.