Supported by Dr. Osamu Ogasawara and  . . |
|
Last data update: 2014.03.03 |
Compute Pretty Axis Tick ScalesDescriptionCompute pretty axis scales and tick mark locations, the same way as traditional R graphics do it. This is interesting particularly for log scale axes. UsageaxisTicks(usr, log, axp = NULL, nint = 5) .axisPars(usr, log = FALSE, nintLog = 5) Arguments
Details
Value
See Also
Examples
##--- Demonstrating correspondence between graphics'
##--- axis() and the graphics-engine agnostic axisTicks() :
require("graphics")
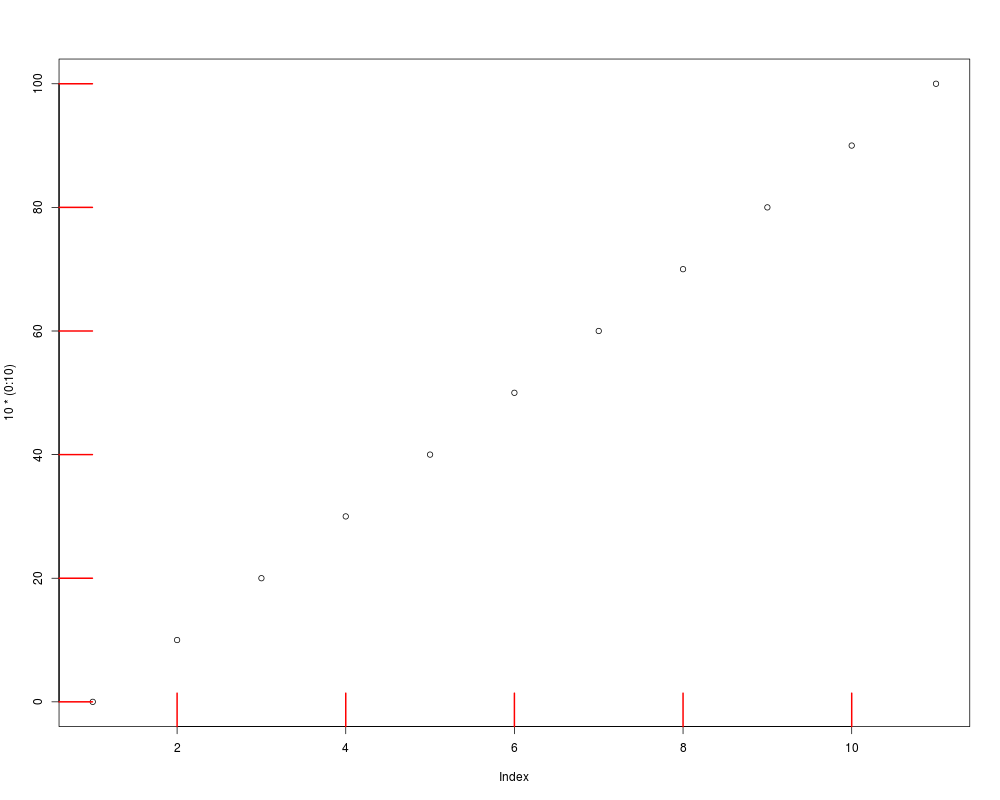
plot(10*(0:10)); (pu <- par("usr"))
aX <- function(side, at, ...)
axis(side, at = at, labels = FALSE, lwd.ticks = 2, col.ticks = 2,
tck = 0.05, ...)
aX(1, print(xa <- axisTicks(pu[1:2], log = FALSE))) # x axis
aX(2, print(ya <- axisTicks(pu[3:4], log = FALSE))) # y axis
axisTicks(pu[3:4], log = FALSE, n = 10)
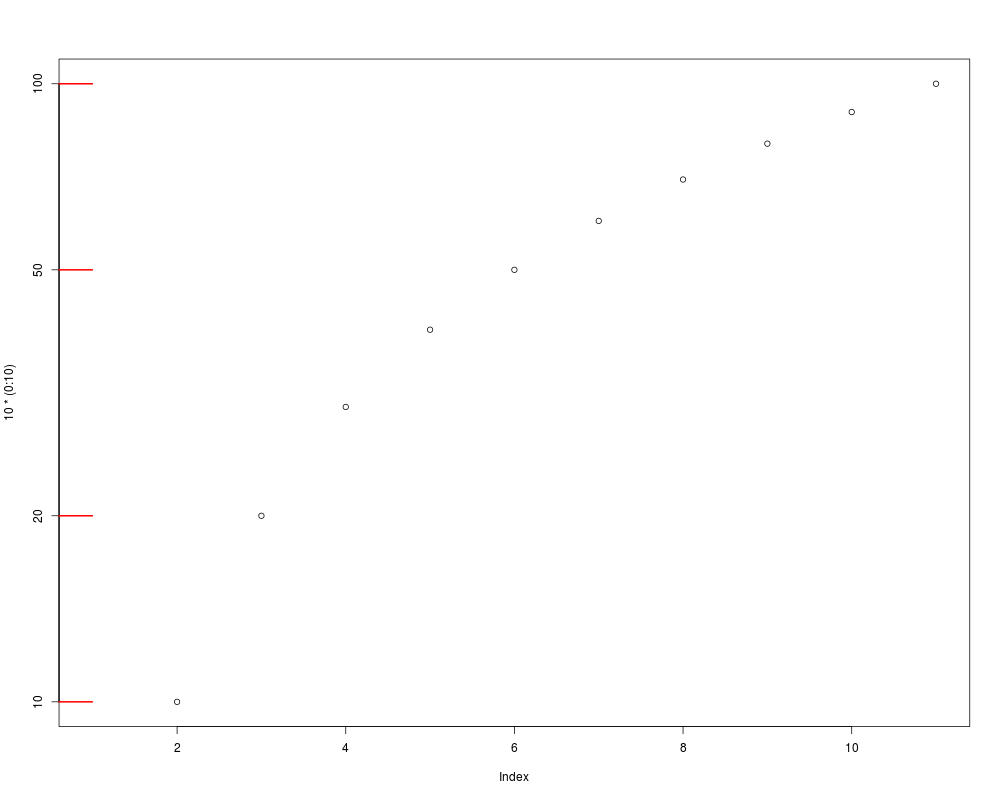
plot(10*(0:10), log = "y"); (pu <- par("usr"))
aX(2, print(ya <- axisTicks(pu[3:4], log = TRUE))) # y axis
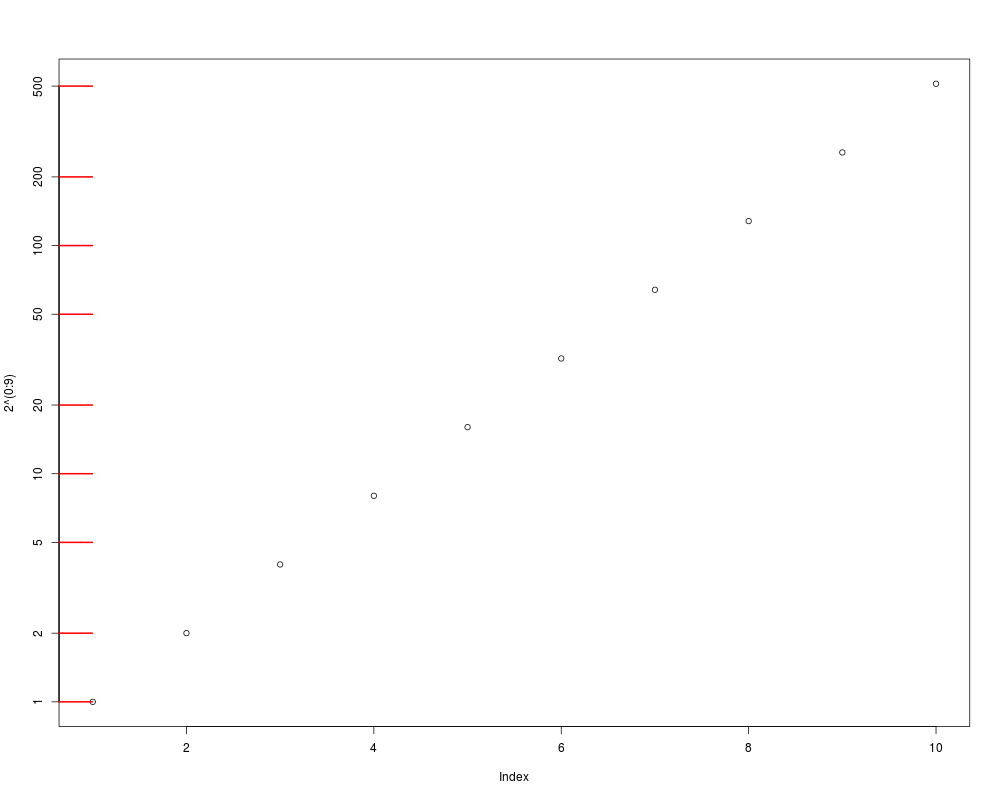
plot(2^(0:9), log = "y"); (pu <- par("usr"))
aX(2, print(ya <- axisTicks(pu[3:4], log = TRUE))) # y axis
Results
R version 3.3.1 (2016-06-21) -- "Bug in Your Hair"
Copyright (C) 2016 The R Foundation for Statistical Computing
Platform: x86_64-pc-linux-gnu (64-bit)

R is free software and comes with ABSOLUTELY NO WARRANTY.
You are welcome to redistribute it under certain conditions.
Type 'license()' or 'licence()' for distribution details.

R is a collaborative project with many contributors.
Type 'contributors()' for more information and
'citation()' on how to cite R or R packages in publications.

Type 'demo()' for some demos, 'help()' for on-line help, or
'help.start()' for an HTML browser interface to help.
Type 'q()' to quit R.

> library(grDevices)
> png(filename="/home/ddbj/snapshot/RGM3/R_rel/result/grDevices/axisTicks.Rd_%03d_medium.png", width=480, height=480)
> ### Name: axisTicks
> ### Title: Compute Pretty Axis Tick Scales
> ### Aliases: axisTicks .axisPars
> ### Keywords: dplot
>
> ### ** Examples
>
> ##--- Demonstrating correspondence between graphics'
> ##--- axis() and the graphics-engine agnostic  axisTicks() :
>
> require("graphics")
> plot(10*(0:10)); (pu <- par("usr"))
[1]   0.6  11.4  -4.0 104.0
> aX <- function(side, at, ...)
+     axis(side, at = at, labels = FALSE, lwd.ticks = 2, col.ticks = 2,
+          tck = 0.05, ...)
> aX(1, print(xa <- axisTicks(pu[1:2], log = FALSE)))  # x axis
[1]  2  4  6  8 10
> aX(2, print(ya <- axisTicks(pu[3:4], log = FALSE)))  # y axis
[1]   0  20  40  60  80 100
>
> axisTicks(pu[3:4], log = FALSE, n = 10)
 [1]   0  10  20  30  40  50  60  70  80  90 100
>
> plot(10*(0:10), log = "y"); (pu <- par("usr"))
Warning message:
In xy.coords(x, y, xlabel, ylabel, log) :
  1 y value <= 0 omitted from logarithmic plot
[1]  0.60 11.40  0.96  2.04
> aX(2, print(ya <- axisTicks(pu[3:4], log = TRUE)))  # y axis
[1]  10  20  50 100
>
> plot(2^(0:9), log = "y"); (pu <- par("usr"))
[1]  0.6400000 10.3600000 -0.1083708  2.8176408
> aX(2, print(ya <- axisTicks(pu[3:4], log = TRUE)))  # y axis
[1]   1   2   5  10  20  50 100 200 500
>
>
>
>
>
>
> dev.off()
null device
          1
>
|