Supported by Dr. Osamu Ogasawara and  . . |
|
Last data update: 2014.03.03 |
Set or View the Graphics PaletteDescriptionView or manipulate the color palette which is used when a Usagepalette(value) Arguments
DetailsThe color palette and referring to colors by number (see
e.g. If If There is only one palette setting for all devices in a R session. If the palette is changed, the new palette applies to all subsequent plotting. The current palette also applies to re-plotting (for example if an
on-screen device is resized or ValueA character vector giving the palette which was in effect.
This is See Also
Examples
require(graphics)
palette() # obtain the current palette
palette(rainbow(6)) # six color rainbow
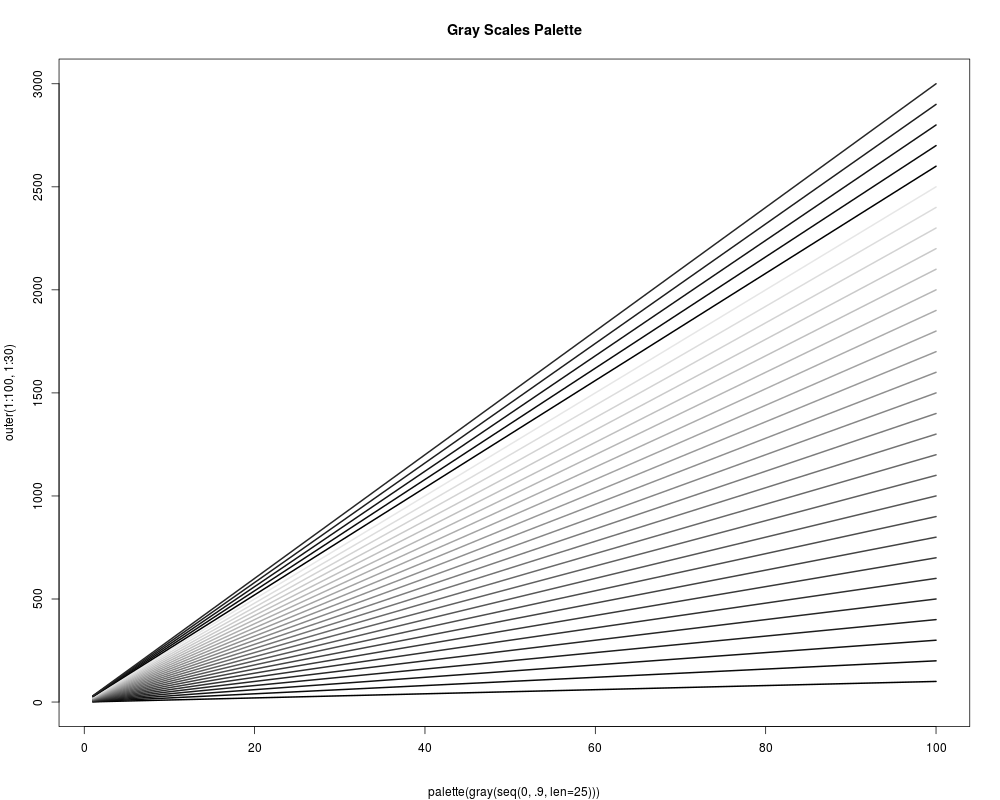
(palette(gray(seq(0,.9,len = 25)))) # gray scales; print old palette
matplot(outer(1:100, 1:30), type = "l", lty = 1,lwd = 2, col = 1:30,
main = "Gray Scales Palette",
sub = "palette(gray(seq(0, .9, len=25)))")
palette("default") # reset back to the default
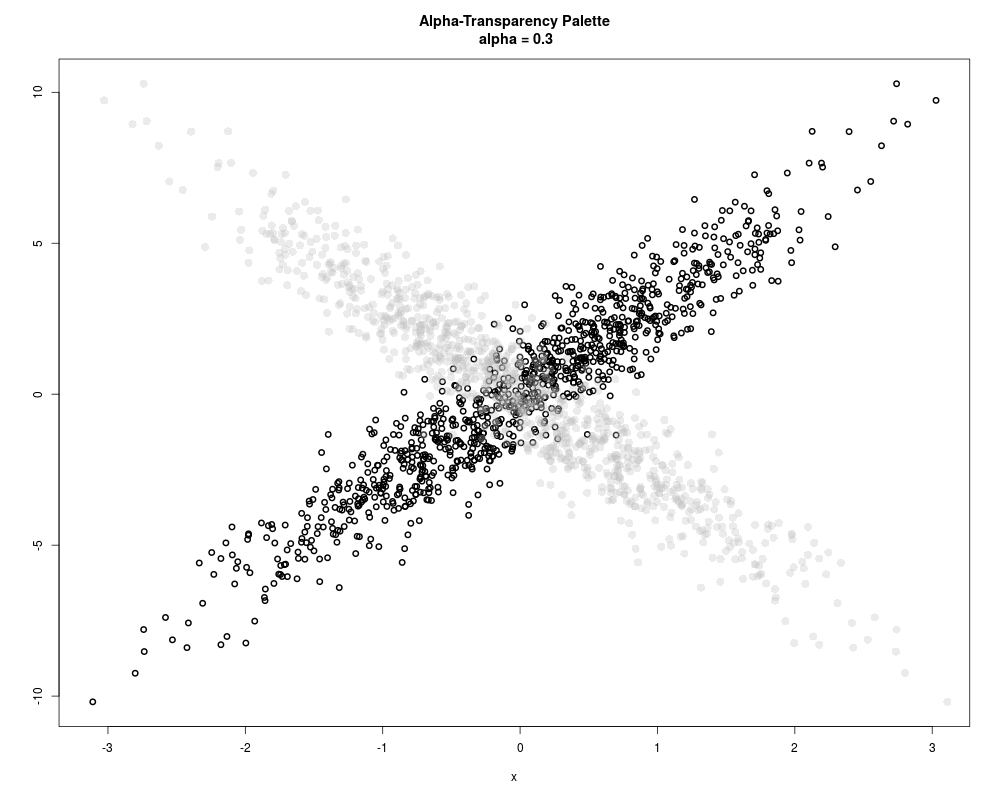
## on a device where alpha-transparency is supported,
## use 'alpha = 0.3' transparency with the default palette :
mycols <- adjustcolor(palette(), alpha.f = 0.3)
opal <- palette(mycols)
x <- rnorm(1000); xy <- cbind(x, 3*x + rnorm(1000))
plot (xy, lwd = 2,
main = "Alpha-Transparency Palette\n alpha = 0.3")
xy[,1] <- -xy[,1]
points(xy, col = 8, pch = 16, cex = 1.5)
palette("default")
Results
R version 3.3.1 (2016-06-21) -- "Bug in Your Hair"
Copyright (C) 2016 The R Foundation for Statistical Computing
Platform: x86_64-pc-linux-gnu (64-bit)

R is free software and comes with ABSOLUTELY NO WARRANTY.
You are welcome to redistribute it under certain conditions.
Type 'license()' or 'licence()' for distribution details.

R is a collaborative project with many contributors.
Type 'contributors()' for more information and
'citation()' on how to cite R or R packages in publications.

Type 'demo()' for some demos, 'help()' for on-line help, or
'help.start()' for an HTML browser interface to help.
Type 'q()' to quit R.

> library(grDevices)
> png(filename="/home/ddbj/snapshot/RGM3/R_rel/result/grDevices/palette.Rd_%03d_medium.png", width=480, height=480)
> ### Name: palette
> ### Title: Set or View the Graphics Palette
> ### Aliases: palette
> ### Keywords: color sysdata
>
> ### ** Examples
>
> require(graphics)
>
> palette()               # obtain the current palette
[1] "black"   "red"     "green3"  "blue"    "cyan"    "magenta" "yellow"
[8] "gray"
> palette(rainbow(6))     # six color rainbow
>
> (palette(gray(seq(0,.9,len = 25)))) # gray scales; print old palette
[1] "red"     "yellow"  "green"   "cyan"    "blue"    "magenta"
> matplot(outer(1:100, 1:30), type = "l", lty = 1,lwd = 2, col = 1:30,
+         main = "Gray Scales Palette",
+         sub = "palette(gray(seq(0, .9, len=25)))")
> palette("default")      # reset back to the default
>
> ## on a device where alpha-transparency is supported,
> ##  use 'alpha = 0.3' transparency with the default palette :
> mycols <- adjustcolor(palette(), alpha.f = 0.3)
> opal <- palette(mycols)
> x <- rnorm(1000); xy <- cbind(x, 3*x + rnorm(1000))
> plot (xy, lwd = 2,
+        main = "Alpha-Transparency Palette\n alpha = 0.3")
> xy[,1] <- -xy[,1]
> points(xy, col = 8, pch = 16, cex = 1.5)
> palette("default")
>
>
>
>
>
> dev.off()
null device
          1
>
|