Supported by Dr. Osamu Ogasawara and  . . |
|
Last data update: 2014.03.03 |
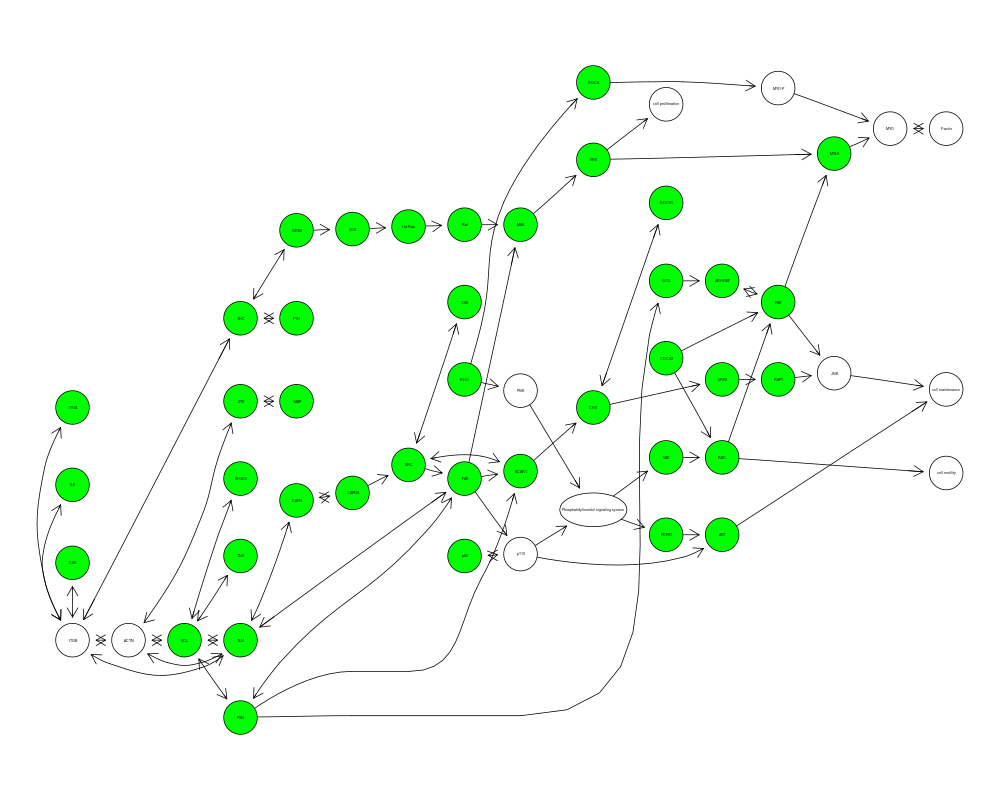
KEGG Integrin Mediated Cell Adhesion graphDescriptionA graph representing the integrin-mediated cell adhesion pathway from
KEGG, as well as a list of attributes for use in plotting the
graph with Usagedata(integrinMediatedCellAdhesion) DetailsThe The first is The second is The values from Sourcehttp://www.genome.ad.jp/kegg/pathway/hsa/hsa04510.html Examples
data(integrinMediatedCellAdhesion)
if (require("Rgraphviz") & interactive())
  plot(IMCAGraph, attrs=IMCAAttrs$defAttrs,
       nodeAttrs=IMCAAttrs$nodeAttrs, subGList=IMCAAttrs$subGList)
Results
R version 3.3.1 (2016-06-21) -- "Bug in Your Hair"
Copyright (C) 2016 The R Foundation for Statistical Computing
Platform: x86_64-pc-linux-gnu (64-bit)

R is free software and comes with ABSOLUTELY NO WARRANTY.
You are welcome to redistribute it under certain conditions.
Type 'license()' or 'licence()' for distribution details.

R is a collaborative project with many contributors.
Type 'contributors()' for more information and
'citation()' on how to cite R or R packages in publications.

Type 'demo()' for some demos, 'help()' for on-line help, or
'help.start()' for an HTML browser interface to help.
Type 'q()' to quit R.

> library(graph)
Loading required package: BiocGenerics
Loading required package: parallel

Attaching package: 'BiocGenerics'

The following objects are masked from 'package:parallel':

    clusterApply, clusterApplyLB, clusterCall, clusterEvalQ,
    clusterExport, clusterMap, parApply, parCapply, parLapply,
    parLapplyLB, parRapply, parSapply, parSapplyLB

The following objects are masked from 'package:stats':

    IQR, mad, xtabs

The following objects are masked from 'package:base':

    Filter, Find, Map, Position, Reduce, anyDuplicated, append,
    as.data.frame, cbind, colnames, do.call, duplicated, eval, evalq,
    get, grep, grepl, intersect, is.unsorted, lapply, lengths, mapply,
    match, mget, order, paste, pmax, pmax.int, pmin, pmin.int, rank,
    rbind, rownames, sapply, setdiff, sort, table, tapply, union,
    unique, unsplit

> png(filename="/home/ddbj/snapshot/RGM3/R_BC/result/graph/IMCA.Rd_%03d_medium.png", width=480, height=480)
> ### Name: integrinMediatedCellAdhesion
> ### Title: KEGG Integrin Mediated Cell Adhesion graph
> ### Aliases: IMCA IMCAAttrs IMCAGraph integrinMediatedCellAdhesion
> ### Keywords: datasets
>
> ### ** Examples
>
> data(integrinMediatedCellAdhesion)
> #if (require("Rgraphviz") & interactive())
>   plot(IMCAGraph, attrs=IMCAAttrs$defAttrs,
+        nodeAttrs=IMCAAttrs$nodeAttrs, subGList=IMCAAttrs$subGList)
>
>
>
>
>
> dev.off()
null device
          1
>
|