Supported by Dr. Osamu Ogasawara and  . . |
|
Last data update: 2014.03.03 |
Compute Axis Tickmark LocationsDescriptionCompute pretty tickmark locations, the same way as R does internally.
This is only non-trivial when log coordinates are active.
By default, gives the UsageaxTicks(side, axp = NULL, usr = NULL, log = NULL, nintLog = NULL) Arguments
DetailsThe
Valuenumeric vector of coordinate values at which axis tickmarks can be
drawn. By default, when only the first argument is specified,
these values should be identical to those that
See Also
Examples
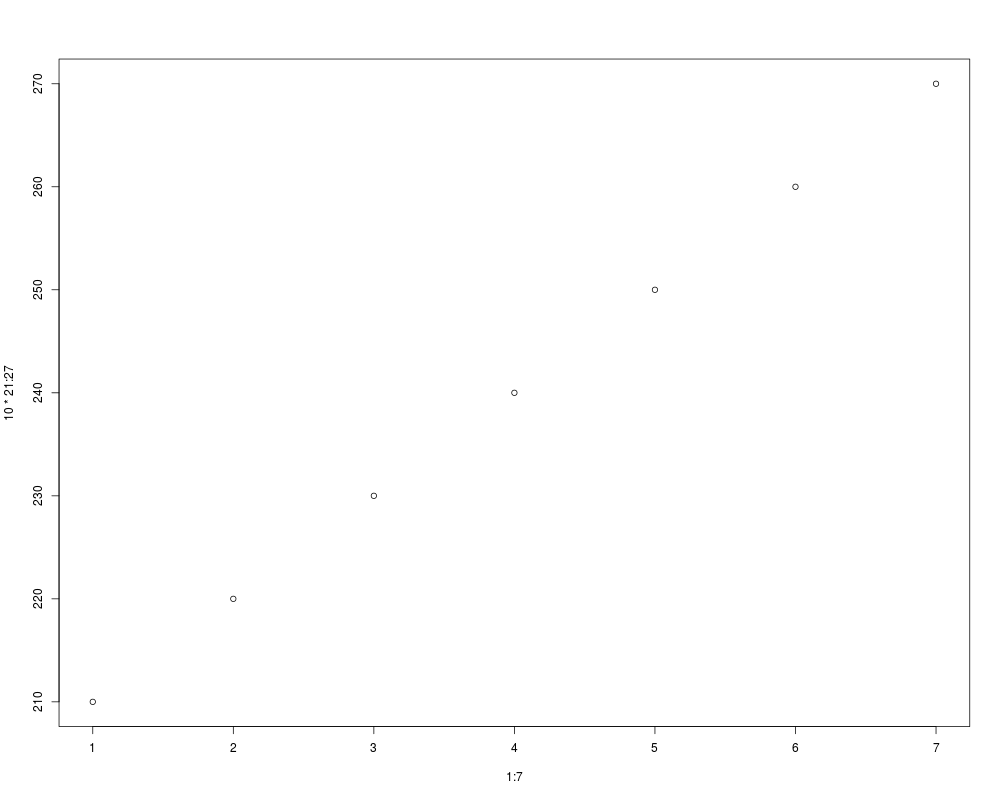
plot(1:7, 10*21:27)
axTicks(1)
axTicks(2)
stopifnot(identical(axTicks(1), axTicks(3)),
identical(axTicks(2), axTicks(4)))
## Show how axTicks() and axis() correspond :
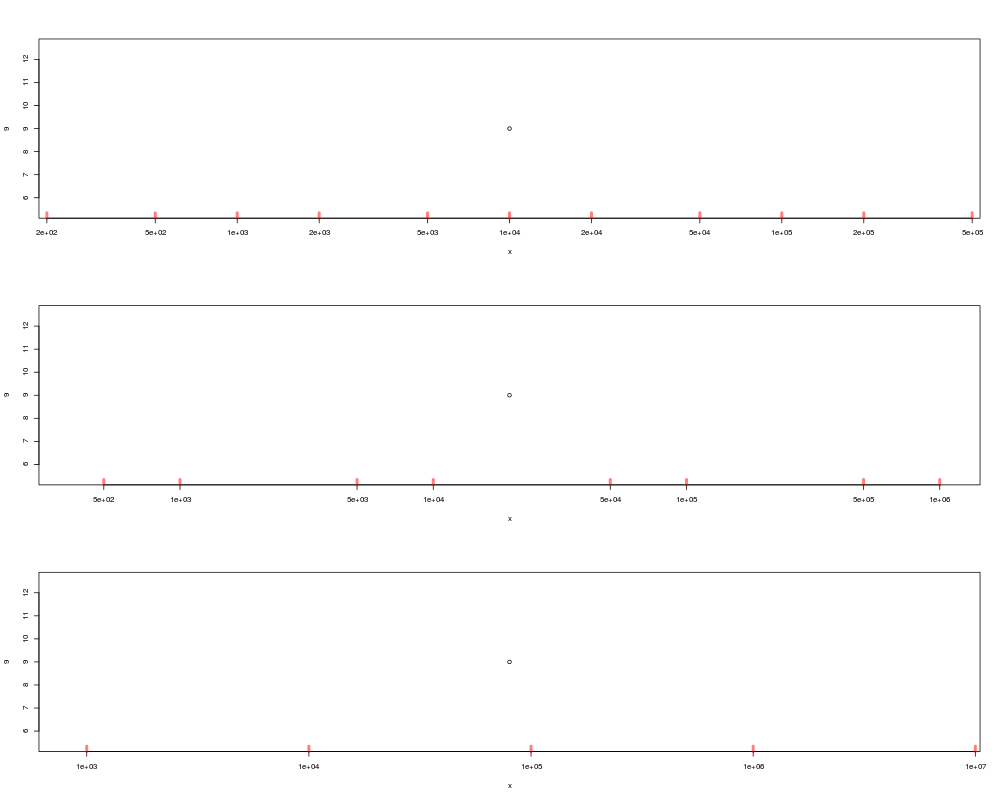
op <- par(mfrow = c(3, 1))
for(x in 9999 * c(1, 2, 8)) {
plot(x, 9, log = "x")
cat(formatC(par("xaxp"), width = 5),";", T <- axTicks(1),"\n")
rug(T, col = adjustcolor("red", 0.5), lwd = 4)
}
par(op)
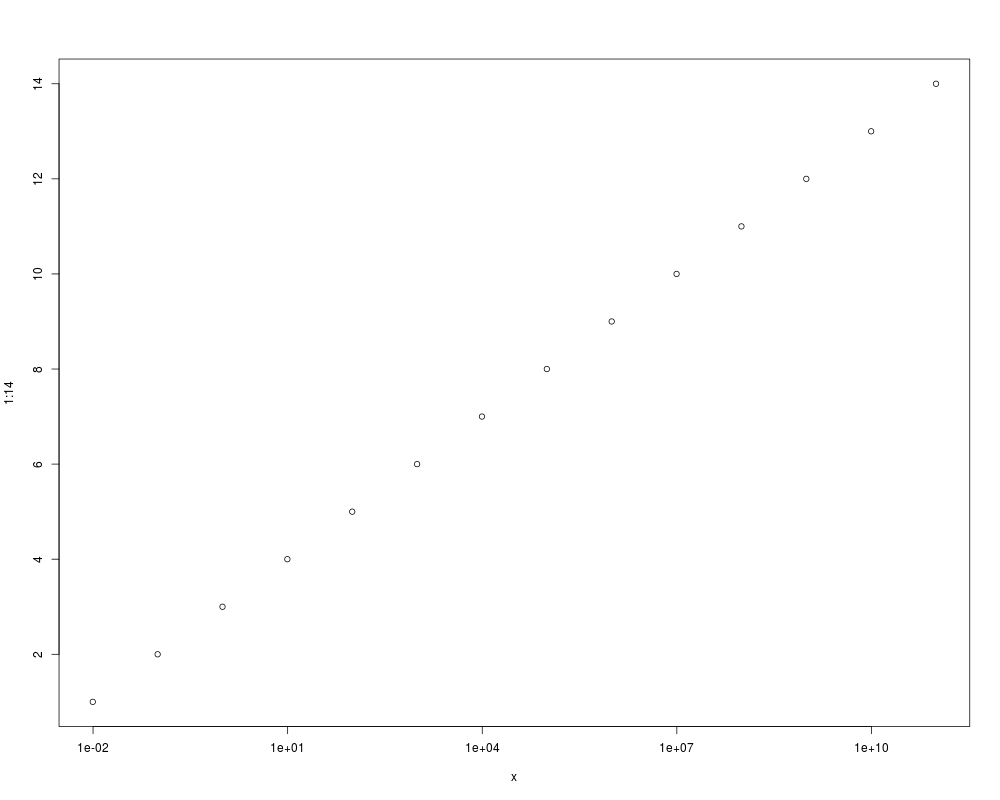
x <- 9.9*10^(-3:10)
plot(x, 1:14, log = "x")
axTicks(1) # now length 5, in R <= 2.13.x gave the following
axTicks(1, nintLog = Inf) # rather too many
## An example using axTicks() without reference to an existing plot
## (copying R's internal procedures for setting axis ranges etc.),
## You do need to supply _all_ of axp, usr, log, nintLog
## standard logarithmic y axis labels
ylims <- c(0.2, 88)
get_axp <- function(x) 10^c(ceiling(x[1]), floor(x[2]))
## mimic par("yaxs") == "i"
usr.i <- log10(ylims)
(aT.i <- axTicks(side = 2, usr = usr.i,
axp = c(get_axp(usr.i), n = 3), log = TRUE, nintLog = 5))
## mimic (default) par("yaxs") == "r"
usr.r <- extendrange(r = log10(ylims), f = 0.04)
(aT.r <- axTicks(side = 2, usr = usr.r,
axp = c(get_axp(usr.r), 3), log = TRUE, nintLog = 5))
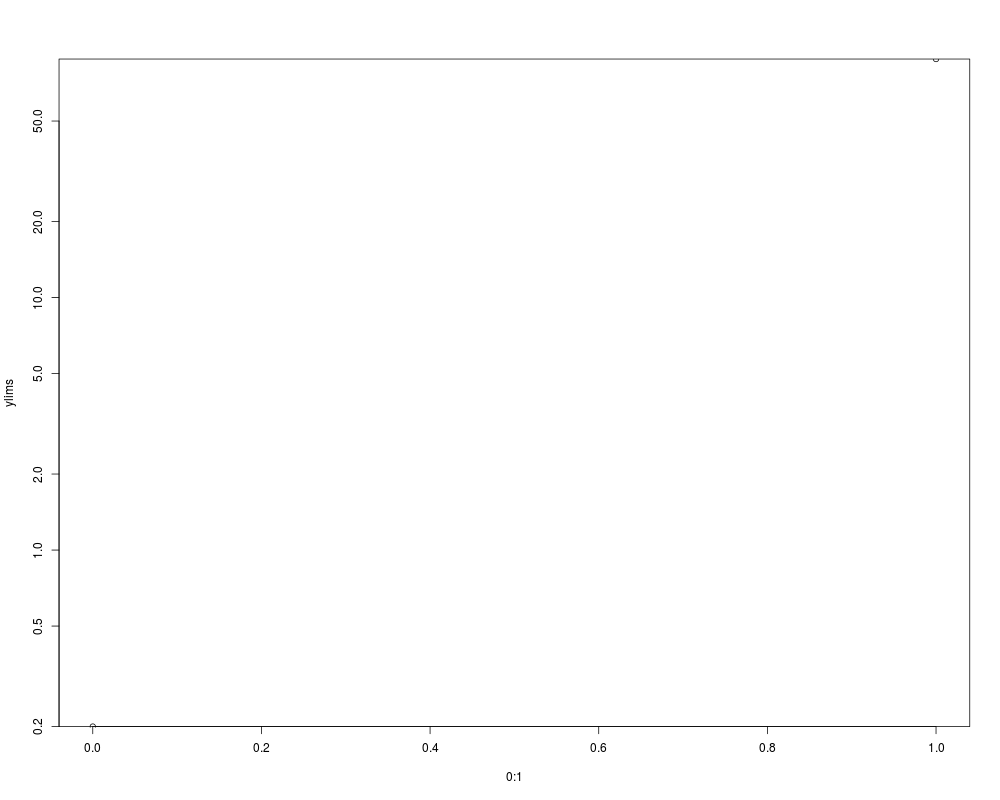
## Prove that we got it right :
plot(0:1, ylims, log = "y", yaxs = "i")
stopifnot(all.equal(aT.i, axTicks(side = 2)))
plot(0:1, ylims, log = "y", yaxs = "r")
stopifnot(all.equal(aT.r, axTicks(side = 2)))
Results
R version 3.3.1 (2016-06-21) -- "Bug in Your Hair"
Copyright (C) 2016 The R Foundation for Statistical Computing
Platform: x86_64-pc-linux-gnu (64-bit)

R is free software and comes with ABSOLUTELY NO WARRANTY.
You are welcome to redistribute it under certain conditions.
Type 'license()' or 'licence()' for distribution details.

R is a collaborative project with many contributors.
Type 'contributors()' for more information and
'citation()' on how to cite R or R packages in publications.

Type 'demo()' for some demos, 'help()' for on-line help, or
'help.start()' for an HTML browser interface to help.
Type 'q()' to quit R.

> library(graphics)
> png(filename="/home/ddbj/snapshot/RGM3/R_rel/result/graphics/axTicks.Rd_%03d_medium.png", width=480, height=480)
> ### Name: axTicks
> ### Title: Compute Axis Tickmark Locations
> ### Aliases: axTicks
> ### Keywords: dplot
>
> ### ** Examples
>
>  plot(1:7, 10*21:27)
>  axTicks(1)
[1] 1 2 3 4 5 6 7
>  axTicks(2)
[1] 210 220 230 240 250 260 270
>  stopifnot(identical(axTicks(1), axTicks(3)),
+            identical(axTicks(2), axTicks(4)))
>
> ## Show how axTicks() and axis() correspond :
> op <- par(mfrow = c(3, 1))
> for(x in 9999 * c(1, 2, 8)) {
+     plot(x, 9, log = "x")
+     cat(formatC(par("xaxp"), width = 5),";", T <- axTicks(1),"\n")
+     rug(T, col =  adjustcolor("red", 0.5), lwd = 4)
+ }
 1000 1e+05     3 ; 200 500 1000 2000 5000 10000 20000 50000 1e+05 2e+05 5e+05
 1000 1e+06     2 ; 500 1000 5000 10000 50000 1e+05 5e+05 1e+06
 1000 1e+07     1 ; 1000 10000 1e+05 1e+06 1e+07
> par(op)
>
> x <- 9.9*10^(-3:10)
> plot(x, 1:14, log = "x")
> axTicks(1) # now length 5, in R <= 2.13.x gave the following
[1] 1e-02 1e+01 1e+04 1e+07 1e+10
> axTicks(1, nintLog = Inf) # rather too many
 [1] 1e-02 1e-01 1e+00 1e+01 1e+02 1e+03 1e+04 1e+05 1e+06 1e+07 1e+08 1e+09
[13] 1e+10 1e+11
>
> ## An example using axTicks() without reference to an existing plot
> ## (copying R's internal procedures for setting axis ranges etc.),
> ## You do need to supply _all_ of axp, usr, log, nintLog
> ## standard logarithmic y axis labels
> ylims <- c(0.2, 88)
> get_axp <- function(x) 10^c(ceiling(x[1]), floor(x[2]))
> ## mimic par("yaxs") == "i"
> usr.i <- log10(ylims)
> (aT.i <- axTicks(side = 2, usr = usr.i,
+                  axp = c(get_axp(usr.i), n = 3), log = TRUE, nintLog = 5))
[1]  0.2  0.5  1.0  2.0  5.0 10.0 20.0 50.0
> ## mimic (default) par("yaxs") == "r"
> usr.r <- extendrange(r = log10(ylims), f = 0.04)
> (aT.r <- axTicks(side = 2, usr = usr.r,
+                  axp = c(get_axp(usr.r), 3), log = TRUE, nintLog = 5))
[1]   0.2   0.5   1.0   2.0   5.0  10.0  20.0  50.0 100.0
>
> ## Prove that we got it right :
> plot(0:1, ylims, log = "y", yaxs = "i")
> stopifnot(all.equal(aT.i, axTicks(side = 2)))
>
> plot(0:1, ylims, log = "y", yaxs = "r")
> stopifnot(all.equal(aT.r, axTicks(side = 2)))
>
>
>
>
>
> dev.off()
null device
          1
>
|